"SAC" Creep Data
Source and Plot
of Data
|
 |
| Figure
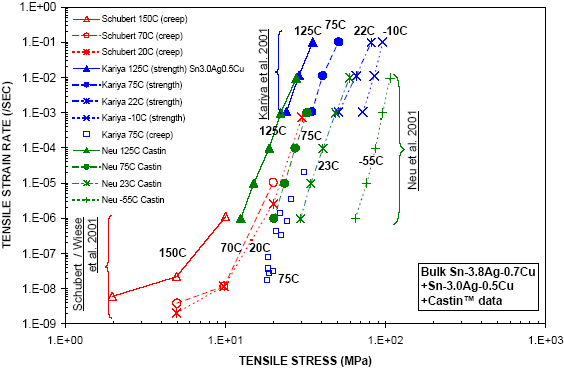
23: Log-log plot of isothermal creep data for Sn-Ag-Cu
and Castin™ bulk solders.
Isothermal creep data from three independent sources are
plotted as tensile strain rate (/second) versus tensile stress
(MPa) in Figure 23. The data covers two orders of magnitude
on the stress axis and eight orders of magnitude on the strain
rate axis. Test temperatures are in the range -55°C to
150°C.
The original data, given in Table B.1, was digitized by
Kil-won Moon of NIST. The raw
data was obtained from the following figures in their respective
publications: |
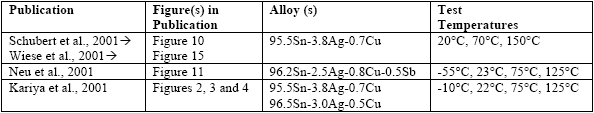 |
| Table 10:
Source of data, alloy composition and test temperatures.
These investigations of SAC properties are fairly recent,
when compared to the Sn-Pb or Sn-Ag literature, since it is
only recently that SAC alloys have received increased attention
from industry. |
|
Specimens |
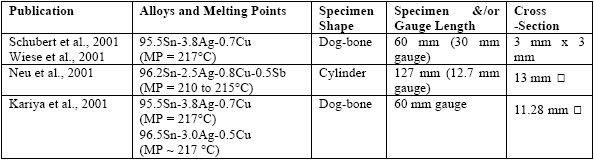 |
Table
11: Specimen Geometries (MP = Melting Point of Alloy). |
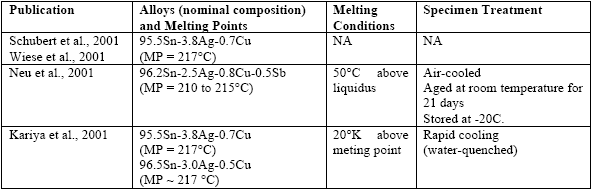 |
| Table
12: Melting Conditions and Specimen Treatments (NA
= not available).
Test specimens were dog-bone- or cylinder-shaped tensile
specimens with specimen and/or gauge length and cross-sectional
dimensions given in Table 11. Melting and cooling conditions
as well as thermal treatment of specimens, when available,
are summarized in Table 12. The reader is referred to the
original publications for additional details on the specimen
preparation.
The alloys have nominal compositions with elemental contents
in the following ranges:
- 95.5 to 96.5% wt. for Sn.
- 2.5 to 3.9 % wt. for Ag.
- 0.5 to 0.8% wt. for Cu.
- Chemical analysis of the 95.5Sn-3.8Ag-0.7Cu (nominal)
alloy studied by Schubert et al. gave a composition of 95.4%
wt. Sn, 3.91% wt. Ag and 0.71% wt. Cu (from Table 1 in Schubert
et al., 2001).
Comparing the specimen information from the three sources,
note that:
- The specimens by Schubert et al. have a significantly
smaller cross-section: 3 mm x 3 mm versus 11.28 mm and 13
mm in diameter for the specimens by Kariya et al. and Neu
et al., respectively.
|
| |
- The above dimensions compare to typical sizes of 0.1 to
0.2 mm (4 to 8 mils) for flip-chip solder joints, or 0.5
mm (20 mils) for Ball Grid Array (BGA) solder joints.
|
- The Kariya et al. specimens were rapidly cooled by water-quenching
while the Neu et al. specimens were air-cooled although
the cooling rate was not reported. The cooling conditions
for the Schubert et al. specimens were not reported.
Microstructures |
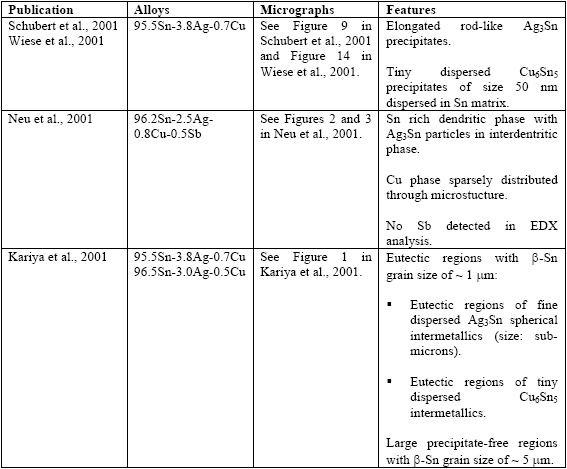 |
| Table
13: Microstructure of bulk "SAC" specimens.
The microstructure of the as-cast SAC solders consists of
the Sn matrix with precipitate-free b-Sn regions and eutectic
(or near-eutectic) regions having Ag3Sn or Cu6Sn5 intermetallic
phases dispersed in the Sn matrix. Specific microstructural
features for the alloys and specimens under study are given
in Table 13.
Test Procedures |
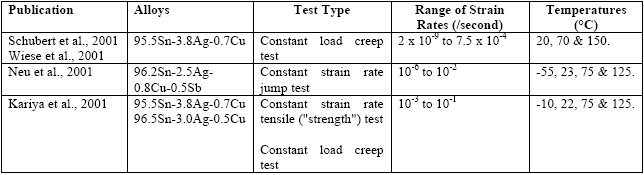 |
| Table
14: Test procedures and conditions.
The test conditions and procedures are summarized in Table
14. The isothermal tensile tests are of three
types:
- Conventional "creep" tests (with constant load
rates) where the linear portion of the strain-versus-time
response gives the "minimum" or steady strain
rate (see Figure 24a).
- Conventional "strength" tests (stress / strain
tests ran at constant strain rates) where the maximum stress
gives the Ultimate Tensile Strength (UTS) of the specimen
at a given strain rate (Figure 24b). Once the UTS has been
reached, the typical response of solder is further elongation
of the specimen at constant stress or with a slow drop in
load.
- Strain rate jump tests which are similar to the above
stress / strain tests except that the strain rate was
increased by a factor of ten after each increment of 1.5%
strain.
|
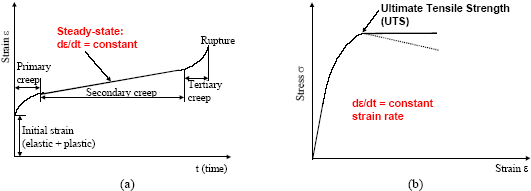 |
| Figure
23: Output of (a) creep test; (b) "strength"
test.
Noteworthy observations about these tests are:
- In general, the first two types of tests give similar
strain-rate-vesus-stress equations since the strain rate
is constant during both the strength test and the steady-state
phase of the creep test. However, one of the limitations
of the creep tests is that they are not run at constant
stress since it is easier to control loads rather than stress.
The reported stress is the initial stress defined as the
applied load divided by the initial cross-section of the
specimen.
- As pointed out by Neu et al., 2001, the strain rate jump
tests allow for the acquisition of tensile strengths at
different strain rates from a single specimen. However,
Neu et al. mentionned that the strength results may be affected
by the history of prior deformations of a given specimen
when jumping from one strain rate to the next.
The reviewed literature focuses on steady-state creep.
To our knowledge, the other deformation modes, i.e. the initial,
instantaneous plastic flow and primary creep have not been
reported on for SAC-type alloys. Based on studies by Darveaux
et al. (1992, 1995), these deformation modes are not negligible
for neareutectic Sn-Pb and Sn-Ag alloys and are worthwhile
investigating further for SAC solders. |
