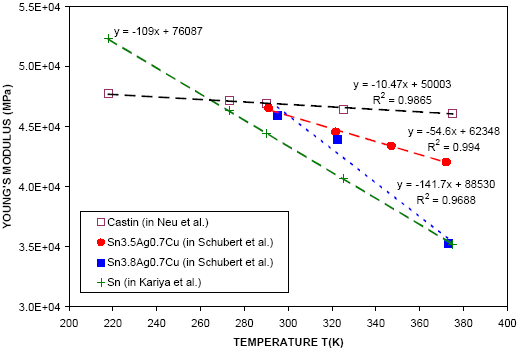
Figure 34:
Plot of SAC Young's Modulus E (MPa) versus temperature T (°K).
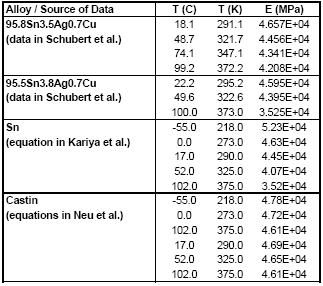
Young's modulus is given versus temperature in Table 15
and the data is plotted in Figure 34. For the two Sn-Ag-Cu
alloys, the data was digitized from Figure 2 in Schubert et
al., 2001. For Sn and Castin, the data was obtained from equations
given in Kariya et al., 2001, and Neu et al., respectively.
For each dataset, a linear trendline and its equation are
shown in Figure 34.
The temperature-dependent Young's modulus is used as material
properties in stress / strain analysis programs such as FEA
codes. Young's modulus is also used to scale steady-state
stresses in some creep rate models.
Poisson's Ratio
Another elastic property that is also used in stress/strain
analysis programs or to convert Young's modulus to a shear
modulus, G, is Poisson's ratio. Neu et al. reported a Poisson's
ratio  =
0.4 for Castin (after Whitelaw et al., 1999), however, we
did not find literature values of Poisson's ratios for the
other SAC alloys. =
0.4 for Castin (after Whitelaw et al., 1999), however, we
did not find literature values of Poisson's ratios for the
other SAC alloys.
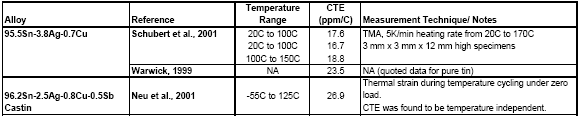
Coefficients of Thermal Expansion
(CTE) |