| Figure
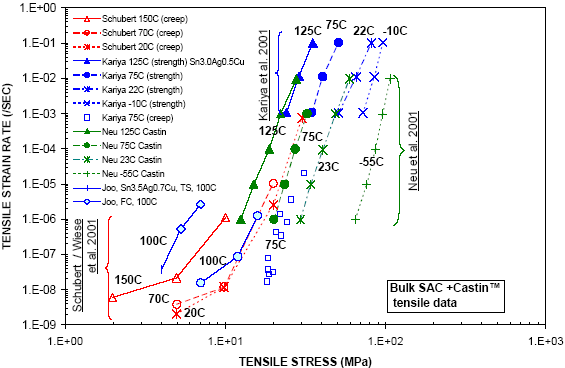
33: Fit of Joo et al.'s Sn-3.5Ag-0.7Cu, 100°C
data to plot of raw SAC tensile data. "TS" = Thermally
Stabililized; FC = Fast Cooled (at 145°K/sec).
In addition to Kim et al.'s data, the Joo et
al. (2002) Sn-3.5Ag-0.7Cu data also confirms the strong effect
of cooling rate and microstructure on creep properties. Joo
et al. conducted creep tests at 100°C on two types of
dog-bone shaped tensile specimens:
- "TS" specimens: 5 mm thick, 8 mm wide x 32
mm long tensile section; cast alloys were cold rolled at
about 50% and heat-treated or Thermally Stabilized (TS)
for 12 hours at 393°K. The resulting size of the
 -Sn
dendritic globules (prior to testing) was 50-100 µm. -Sn
dendritic globules (prior to testing) was 50-100 µm.
- "FC" specimens: 1 mm thick, 8 mm wide x 19 mm
long tensile section; specimens that were cast in a thin
aluminum mold were water quenched from the melting point
at a cooling rate of about 145°K/sec (FC = Fast-Cooled).
The resulting size of the -Sn
dendritic globules (prior to testing) was 5-10 µm.
The secondary creep results are added to our first plot
of raw creep data (Figure 23) as shown in Figure 33. The raw
data, digitized from Figure 5 in Joo et al. (2002), is listed
in Table B.5. To a first order, and in spite of slight differences
in Ag and Cu contents, the Joo et al. FC data seems to fit
in with the other datasets:
- The 100°C FC data falls between the 70°C and
150°C Schubert data. We cannot be more conclusive on
this because the Schubert et al. paper did not report on
cooling rates and the size of the -Sn
globules.
- By extrapolation to stress levels in the range 10 to
20 MPa, the 100°C FC data also shows continuity with
the Kariya et al.'s data and would fall somewhere between
the Kariya et al.'s datasets at 75°C and 125°C.
This is encouraging since the Kariya et al.' specimens were
also rapidly cooled (waterquenched) with a grain size of
the -Sn
globules given at approximately 5 mm, similar to the 5-10
µm globules in Joo's FC specimens.
On the other end, the 100°C TS data from Joo et al.
is offset from the rest and lies about two orders of magnitude
above the FC data in the direction of the strain rate axis.
As discussed in Joo et al. (2002), and from elementary material
science, this offset between the FC and TS data is mostly
due to differences in the micro-structures (5-10 µm
-Sn
globules for FC vs. 50-100 µm globules for TS). The
two order-of magnitude effect from the Joo et al.'s data is
also consistent with the 100 X difference in strain rates
for the SC and RC specimens of Kim et al. |