
Metallurgy Division Publications - NISTIR 7127
Technical Highlights |

|
The following Technical Highlights section includes expanded descriptions of research projects that have broad applicability and impact. These projects generally continue for several years. The results are the product of the efforts of several individuals. The Technical Highlights include:
• Formation of Glass by a First Order Transition • Interactions With Industry: Delivering Data and Standard Test Methods for Sheet Metal Forming • Breakthroughs in Magnetic Refrigeration • On-Chip Interconnects: Extending Performance of Sub-100 nm Lines • The Structural Steel of the World Trade Center Towers
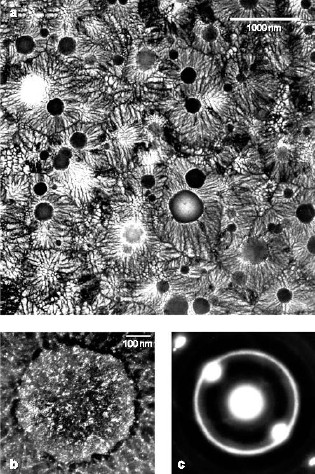
Formation of Glass by a First Order TransitionRecently the aerospace, military and electronics industries have devoted much effort to the development of practical materials that are 100 % bulk metallic glass but do not require extremely rapid quenching. Most glassy solids are thought to be kinetically frozen liquids, thus the usual approach is to cool fast enough to prevent formation of crystals. We have presented evidence that an isotropic non-crystalline metallic phase (dubbed “q-glass”) in the Al-Fe-Si system forms during rapid cooling of the melt by a first order transition, like a crystalline phase, suggesting the possibility of low-energy, non-periodic structures and the formation of glasses by relatively slow growth. NIST Contact: Leonid A. Bendersky and John W. CahnMuch DoD research has focused recently on the development of bulk metallic glasses (e.g., DARPA SAM program) for use as both armor materials and kinetic penetrators. Production of such glasses requires moderate rates of melt quenching in contrast to the rapid quenching required for conventional metallic glasses. These studies have all assumed that the glassy phases form only as a frozen liquid. In order to gain an understanding of the processing routes available to control these and related materials, it is essential to determine how these structures actually form. Such distinctions in the formation of various glassy phases may play an important role in their relative ductility, corrosion resistance and stability. The compositional and structural nature of the glassy phases is, thus, a question of more general interest. An Unusual Microstructure Found in Rapidly Solidifed Al-Fe-SiRecently we presented evidence that an isotropic non-crystalline metallic phase (dubbed “q-glass”) could be formed by growth from a melt. This phase is the first phase, or “primary phase,” to form in the Al-Fe-Si system during rapid cooling of the melt.[1] There is strong evidence that this phase forms from the melt by a first order transition. According to transmission electron microscope (TEM) observations, Figure 1a, the q-glass nucleates from the melt as isolated particles, which initially grow as spheres (nodules). The diffraction pattern taken from a nodule shows it to be an isotropic glassy phase, Figure 1c. Dark field, Figure 1b and high-resolution TEM imaging, Figure 2, also support the isotropic, but highly speckled, nature of the phase. There is a nucleation barrier, which implies an interface between the glass and the melt. Further evidence for the first order transition is found in the solute partitioning at this interface; the q-glass rejects Al into the melt, which ultimately solidifies as a eutectic composed mainly of crystalline fcc aluminum and more q-glass. Presumably glass and melt are distinct phases with an interface having a positive, surface-free energy. Such solidification microstructures are familiar and well understood, except that here the glass is the first phase growing from the melt and eventually becomes surrounded by eutectic, instead of being the last phase (sometimes the only phase) formed when atomic motion ceases in the melt.
Figure 1: a) Microstructure of an Al91Fe7Si2 alloy after electron-beam surface melting with scan velocity of 50 cm/sec. b) Dark field image of a nodule and the glassy phase in the monotectic, obtained by positioning a SAD aperture on the strongest diffuse ring in c).
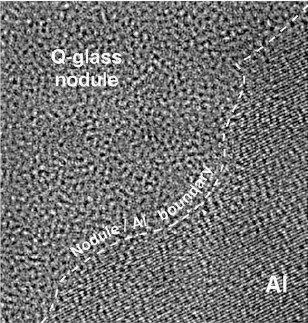
Figure 2: High-resolution TEM image showing an interface between a glassy nodule (q-glass) and Al. Note the isotropic phase contrast of the q-glass. Q-Glass PropertiesStability. A lower entropy implies a higher degree of order, which in turn is consistent with a process of growth that selects some components and rejects others. This seems to be the case for the q-glass where Al is rejected into the melt. The lower entropy implies that at low temperatures the q-glass may have greater stability than a conventional glass (frozen liquid) of the same composition, and that there would be a latent heat associated with its formation which, as is true for all incongruent freezing, is spread over a freezing range. The q-glass in Al-Fe-Si is metastable, as were the original AlMn quasicrystals. Based on the quasicrystal experience, it is expected that, in time, fully stable q-glasses will be found in systems with more components. Structure and Order. The implied order and narrower composition range are closely related. We expect q-glasses to have a chemical order with a smaller set of local environments. Recently, there have been many advances in creating orderly arrangements which are not crystalline.[2] This work suggests that it might be possible that a glassy structure is composed of unit cells which are not parallelepipeds and cannot be packed in a periodic or quasiperiodic way. Unlike the pinwheel tilings in two dimensions which take on every orientation but need matching rules to prevent them from packing periodically, there are 3-D Schmitt–Conway–Danzig tiles which can fill space only in an aperiodic way.[2] If atoms pack into such a unit cell, q-glasses could be stoichiometric and have low entropy, as do crystalline compounds. There is some confirmation for such order in hydrogen-storage alloy glasses. For these glasses, the charging and discharging pressure have a long plateau, just as for crystals. This unusual behavior for glasses implies a highly ordered glass structure in which there is only one type of site for the stored hydrogen. On-Going WorkThe concept of q-glass was introduced at the MRS meeting last year at “Symposium MM: Amorphous and Nanocrystalline Metals.”[1] Since then, our work has received support from the Air Force Office of Scientific Research. Current work is focused on three areas:
For More Information on this Topic
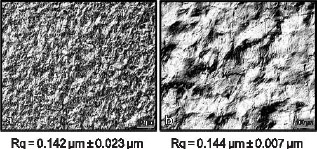
Interactions with Industry: Delivering Data and Standard Test Methods for Sheet Metal FormingThe automotive industry’s push to incorporate lighter sheet metal parts into new car designs has been hampered by lack of detailed data on mechanical behavior for forming. The Metallurgy Division has developed new metrology and test methods to address specific problems identified by industry as inhibiting broad adaptation of high-strength steel and aluminum sheet in automotive applications. NIST Contact: Tim Foecke, Mark Stoudt, and Mark IadicolaThe Sheet Metal Forming program within the Metallurgy Division has been designed from the outset to be relevant to the American manufacturing sector. Surveys conducted by NIST staff through the Industrial Liaison Office (ILO) sought to determine which aspects of sheet metal forming were most in need of better data and metrology. The results revealed that industry had a clear understanding of how NIST expertise could be applied and predicted a high potential impact if the research was successfully implemented. The U.S. automotive industry estimates that the costs associated with the inability of the finite element models to adequately predict friction, multiaxial hardening, or springback are on the order of hundreds of millions of dollars annually. These shortcomings are the direct result of insufficient property data and the physical understanding that such data can reveal. The projects described here are specifically designed to address the quality of the sheet metal property data and models used to develop predictive finite element models of forming operations. The Microstructural Origin of Roughening and Strain LocalizationSurface roughness is a major contributor to friction during sheet metal forming, and thus must be well controlled in order to obtain a consistent product. Furthermore, the surface qualities of the finished product determine ultimate aesthetic characteristics of the vehicle. Ability to accurately characterize surface roughness is, therefore, of critical importance to the industry. There are many sources of error in surface roughness measurements. Recent studies of the discrepancies between measured and predicted surface roughness show that the greatest error is introduced by the numerical tools used routinely by industry to interpret the roughness data. Parameters such as the rms roughness (Rq) compress complex surface details into singular expressions that do not adequately represent the surface features involved (Figure 1). Changes in the surface feature arrangement, which are not captured by the rms roughness, have a greater influence on friction. Hence, any prediction of friction that is based solely on a tool such as the rms roughness is likely to yield erroneous results.
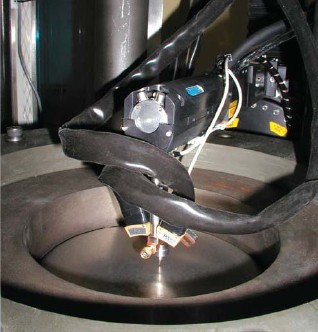
Figure 1: Two surface conditions exhibiting the same roughness mathematically, but very different appearances and frictional behaviors. These results were presented to the automotive industry at several major research conferences in the past year. Invited presentations included talks at the “2004 Society of Automotive Engineers World Congress” in Detroit, MI, the “2004 North American Deep Drawing Research Group” spring meeting at NIST, the “Springback Compensation Program” and the “Agile Flexible Binder Control” quarterly meetings held at the U.S. Council for Automotive Research (USCAR) in Southfield, MI, as well as the “Automotive Sheet Steels Symposium” in Chicago, IL. The results were also published in both archival journal and in conference proceeding formats. Overall, the industrial response has been very positive, and there is a high level of interest in the outcome of new studies. The high-resolution surface topography data obtained with the Metallurgy Division’s scanning laser confocal microscope has been particularly well received and has stimulated several new opportunities identified by our industrial contacts for direct collaboration with the automotive industry. Multiaxial Flow Surfaces and Stress-Based Forming Limit CurvesAn X-ray stress measuring system was recently installed on the sheet metal formability station. This unique instrumentation allows for the direct, in situ measurement of the stress in a given direction while the sample is under multiaxial load. This year, the multiaxial stress–strain surfaces have been mapped for three aluminum sheet alloys of particular interest to the automotive industry: AA5182, AA6111 and AA6022. With this experimental system, shown in Figure 2, we have made the first-ever recorded measurements of the biaxial hardening exponent. These data will provide a substantial advantage to industry, allowing the replacement of current practices that estimate biaxial flow behavior from a series of extrapolated uniaxial tensile tests. This new approach is expected to enable more accurate designs and greater cost savings.
Figure 2: Newly installed X-ray stress measuring system as it takes data on sheet metal being deformed in biaxial tension. Press releases and technical articles have brought these new capabilities to the attention of industry. Visits and inquiries from companies such as ISG-International Steel Group, Volvo, and Avesta–Polarit have stimulated the exploration of mutually beneficial research that can produce enabling data and new insights into formability. Accumulated plastic strain has been used for decades to describe the deformation limits of sheet metal. However, this formalism does not account for path dependence (i.e., how deformation response depends on how it is deformed). Stress, on the other hand, is an intrinsic property of metals, and the ability to describe a process in terms of critical stresses rather than strains would remove the dependence on path. Recent work at GM suggests that this approach would greatly improve finite element predictions by better defining the safe working envelope of the materials. Still needed are direct measurements of multiaxial flow surfaces, measurements that only NIST can provide. A collaboration with GM has been developed using these new data to remove the pure isotropic and kinematic hardening models currently in use. Improvements to the modeling and limit formalisms will be directly transferred to the auto industry. NUMISHEET 2005A triennial international conference focusing on simulation techniques for sheet metal forming die design will be held in Detroit in 2005. An integral part of this conference is a round-robin simulation exercise where various modeling groups try to predict the final shape of a prototypical forming operation. NIST has been asked to take the key role of measuring material properties and then forming the prototype part. This year, the new NIST capability to measure stresses in situ has allowed an increase in the complexity and sophistication of the round-robin simulation. Prediction of both through-thickness residual stresses in a sheet that has undergone multiple forming operations and the stresses in orthogonal directions in a sheet under load in a die have become vital components of the benchmark for the conference, representing a “next-level” challenge for modelers to predict. Springback Prediction“Springback,” during and after forming operations, limits the accuracy and consistency of the final part. The cup test for measuring springback is a fairly recent development and has not been completely characterized. NIST development and testing of the springback cup test has now been largely completed. A collaboration with U.S. Steel has shown that computer models that have been recently modified to account for springback can now accurately predict the final geometry of the sample. More significantly, the models come close to predicting the residual stress profiles that NIST has measured with neutron and X-ray diffraction. Working with ASTM and industry, NIST has submitted the flat-bottomed springback cup test for consideration as a standard measurement protocol for the capacity for elastic springback. A committee, led by Ford and including both material suppliers and end-users, will consider this new test. Data generated by NIST on the robustness of the test and the sensitivity to experimental variations will form the basis of round-robin analyses. For More Information on this TopicL.E. Levine (Metallurgy Division, NIST); T. Gnäupel–Herold, H. Prask (NIST Center for Neutron Research); M. Shi (USS); E. Chu (ALCOA); C. Xia (Ford); T. Stoughton, M. Wenner, C.T. Wang (GM); A. Lin (Univ. of Illinois) Back to Top
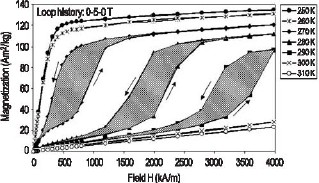
Breakthroughs in Magnetic RefrigerationIn the past 10 to 15 years, there has been a substantial effort to find alternative cooling technologies to vapor compression systems. This has been driven largely by the need to reduce the high energy costs of present systems along with their use of harmful CFC refrigerants. Magnetic refrigeration technology is one such alternative. In principal, because it is a reversible process, magnetic cooling should be more efficient than the competing irreversible vapor compression systems. However, magnetic cooling technology has historically been relegated to cryogenic, high-magnetic field applications since efficiency was so poor at higher temperatures. In 2004, we made progress in identifying materials with greatly improved performance close to room temperature. For U.S. industry to take advantage of these new materials, their behavior needs to be understood and methods of proper measurement determined. We are providing the metrology to do that. NIST Contact: Robert Shull, Virgil Provenzano, and Alexander ShapiroIn 1997 a large (“giant”) magnetocaloric effect was reported in the Gd5Ge2Si2 compound between 270 K and 300 K, thereby generating a great deal of interest as a potential near-room temperature magnetic refrigerant. Unfortunately, large hysteretic losses occur in the same temperature range where this compound exhibits its large magnetocaloric effect, making the magnetic refrigeration with the material inefficient. In Nature [Vol. 429, p. 853 (2004)], we reported on the discovery of an effective and straightforward method for greatly reducing (by more than 90 percent) the large hysteresis losses in Gd5Ge2Si2. This is accomplished by alloying the compound with a small amount of iron, which has the additional benefit of shifting the magnetic entropy change (∆Sm) peak to higher temperature, from 275 K to 305 K, and broadening its width. Although the addition of Fe yields comparable refrigerant capacity (RC) values, a greater resultant value is obtained for the Fe-containing alloy when the hysteresis losses are subtracted. The Fe-containing alloy is clearly better for near-room temperature magnetic refrigeration applications. Figure 1 shows the magnetization (M) vs. applied magnetic field (H) data measured in the important temperature range of peak magnetocaloric effects for the Gd5Ge2Si2 compound. In this material, the enhanced values of the magnetocaloric effect have been ascribed to the existence of a field-induced crystallographic phase change in the material from a low-field paramagnetic structure to a high-field ferromagnetic crystal structure. As a consequence of this field-induced phase change, there is hysteresis in its transformation, shown by the shaded areas enclosed within the field cycles, corresponding to the cost in energy to make one cycle. The magnitude must be assessed when determining whether a particular refrigerant is useful in a given application.
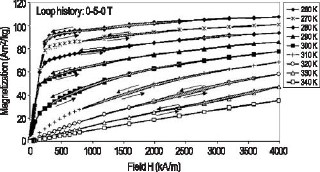
Figure 1: Magnetic hysteresis measurements showing a field-induced ferromagnetic transition and large hysteresis in the “giant magnetocaloric effect” Gd5Ge2Si2 compound. We have found that by adding a small amount of Fe to the Gd5Ge2Si2 compound, the hysteresis may be significantly reduced. This effect is shown in the M vs. H data for this alloy in the important temperature range of potential use in Figure 2, where the shaded hysteresis regions are nearly zero.
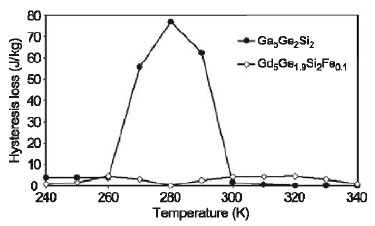
Figure 2: Magnetic hysteresis measurements showing no field-induced ferromagnetic transition and nearly zero hysteresis in the Gd5Ge1.9Si2Fe0.1 alloy. A magnetic field is alternately applied and removed from a refrigerant during a single cooling cycle in a magnetic refrigerator, thus any magnetic hysteresis will reduce the usefulness of a material. Figure 3 shows exactly how much of a difference in hysteresis there is between the Gd5Ge2Si2 and Gd5Ge1.9Si2Fe0.1 alloys.
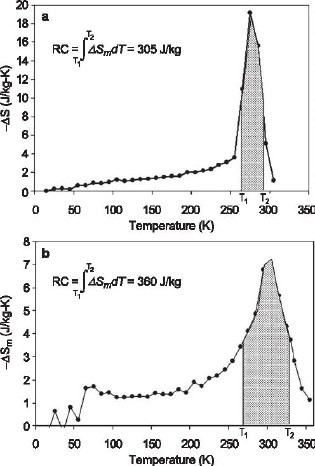
Figure 3: Hysteresis energy loss as a function of temperature for the Gd5Ge2Si2 and Gd5Ge1.9Si2Fe0.1 alloys. The reduced hysteresis in the quaternary alloy is due to a lack of field-induced paramagnetic-to-ferromagnetic crystallographic phase change. This change in behavior is caused by the Fe combining with primarily the Si in the ternary compound to form an Fe-rich secondary phase, thereby reducing the Si content in the majority Gd-Ge-Si phase. As a consequence, the thermodynamics of the Gd-Ge-Si alloy were changed from that of the precursor Gd5Ge2Si2 compound. The magnetic entropy change (∆Sm) for a 5 T applied field as a function of temperature for both alloys is shown in Figure 4. The computed refrigerant capacities (RC) are indicated on the figures and shown by the shaded areas. Compared to Gd5Ge2Si2, the iron-containing compound exhibits a smaller, but broader ∆Sm peak, and a ∆Sm peak at a higher temperature. Purely on this basis, Gd5Ge2Si2 is the superior material, but the Fe-containing alloy might be attractive for higher temperature applications due to its higher temperature peak. One method to account for the hysteresis losses of each alloy is to simply subtract it from the corresponding refrigerant capacity value. Subtraction of the average hysteresis in the temperature range of the ∆Sm peak for each alloy (~ 65 J/kg and ~ 4 J/kg, respectively, for the ternary and quaternary alloys) from the corresponding refrigerant capacity values yielded approximate values of 240 J/kg for the Fe-free alloy and 355 J/kg for the Fe-containing alloy. Consequently, when the hysteresis losses are taken into account, it is clear that the Gd5Ge1.9Si2Fe0.1 alloy is a much better magnetic refrigerant than the Gd5Ge2Si2 compound despite its lower ∆Sm peak value. Most prior evaluations of magnetic refrigerants have disregarded the material hysteresis losses, and in some materials these losses can be quite large; this example shows the weakness in that approach.
Figure 4: Computed ∆ Sm [for ∆ H = 3980 kA/m (5 T)], normalized with respect to sample mass, of the Gd5Ge2Si2 compound (top) and of the Gd5Ge1.9Si2Fe0.1 alloy (bottom), plotted as a function of temperature showing the presence of peaks centered near 270 K and 305 K respectively for Gd5Ge2Si2 and Gd5Ge1.9Si2Fe0.1. “The results are pretty amazing,” states Michael DiPirro [Science News 165, 405 (2004)], a cryogenic engineer at the NASA Goddard Space Flight Center in Greenbelt, Maryland. For More Information on this TopicVirgil Provenzano, Robert D. Shull, and Alexander J. Shapiro, “Reduction of hysteresis losses in the magnetic refrigerant Gd5Ge2Si2 by the addition of Iron,” Nature 429, 853 (2004). Back to Top
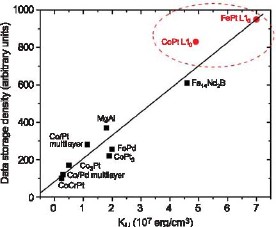
Grand Challenges in Nanomagnetics: High Coercivity FePt Alloys for Future Perpendicular Magnetic Data StorageThe magnetic data storage industry is seekingto sustain the 30-year trend of exponentially increasing storage density. This must be achieved at the same time as maintaining the stability of therecorded data. The Metallurgy Division at NISTis collaborating with Seagate Technology to develop the processes required to produce patterned media of high-magnetic coercivity that will meet this challenge. NIST Contact: Jonathan J. Mallett, Thomas P. Moffat, and William F. Egelhoff, Jr.Conventional magnetic data storage media are based on granular films in which many fine grains are used to define each magnetic bit. The minimum number of grains per bit is limited by the irregularity of the shape and spacing of the grains, which produces irregular boundaries between bits. This irregularity results in noise in the read signal and can only be constrained at an acceptable level by maintaining a fixed minimum number of grains per bit. The natural approach to increasing data storage density has been to reduce the grain size, while maintaining the same number of grains per bit. The limit to this approach occurs when the magnetic energy barrier to the reversal of magnetization of each grain approaches the energy of random thermal fluctuations. At this point, the medium is no longer stable against spontaneous magnetization reversal and consequential data loss. The grain size at which this limit occurs depends on the magnetocrystalline anisotropy energy of the magnetic material. FePt in its L10 phase has a sufficiently large anisotropy energy to allow magnetically stable grains of 5 nm diameter (Figure 1). Furthermore, FePt deposited by a variety of means typically forms grains approaching this size. Unfortunately, the annealing treatment required to transform the as-deposited A1-structured FePt to the desirable L10 phase is widely found to result in an increase in grain size to 100 nm. Current efforts at NIST focus on developing a method of electrochemically depositing FePt into a regular patterned template, circumventing the problem of grain growth. Simultaneously, the imposed regularity of the magnetic cells opens the possibility of addressing single cells (i.e., of using one “grain” per bit). The estimated achievable density from such an approach is 7 Tbits per square inch, which is 100 times higher than current storage densities. Electrodeposition is an obvious choice for deposition into high aspect ratio templates, since it does not suffer from the shadowing effect that characterizes vacuum deposition techniques.
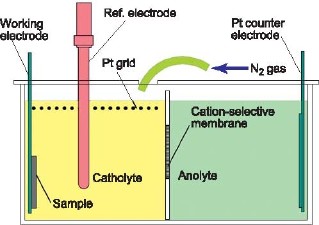
Figure 1: The dependence of storage density on magnetocrystalline anisotropy energy. The most promising materials are FePt and CoPt. Electrodeposition of FePt from aqueous solutions presents many challenges. The double cell shown in Figure 2 has been developed to address the problem of the instability of Fe2+ solutions, which readily oxidize to produce insoluble Fe(OH)3. The plating solution, containing FeCl2 and PtCl4 (left) is separated from the anode by a cation selective membrane, preventing the oxidation of Fe2+ to Fe3+ that would otherwise occur at the anode. Fe3+ formation by oxidation with air is also minimized by blanketing the cell in nitrogen, and residual Fe3+ is reduced to Fe2+ by an auxiliary platinum grid electrode.
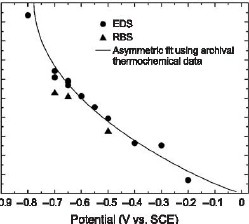
Figure 2: The double cell, designed to minimize the concentration of Fe3+ and dissolved O2 in the FePt plating solution. The alloy composition of 300 nm thick films deposited from this solution was found to depend mainly on the applied potential and to be insensitive to the concentration of the solution components. A thermodynamic regular solution model was used to describe the dependence of film composition on applied potential. The comparison of theory to experimental data can be seen in Figure 3.
Figure 3: The theoretical and experimental dependence of composition on the applied potential. The deposited films were found to be remarkably smooth, with RMS roughness values less than 5 nm for micron-thick deposits. This was surprising given the large platinum overpotential (supersaturation), which usually results in growth instabilities and consequent roughening. The control of crystal orientation is an essential consideration for high-density recording applications. A transition in the recording industry is currently in progress to perpendicular media, in which the bits are magnetized perpendicular to the plane of the medium. Maximum advantage can be derived from L10 FePt as a perpendicular medium when it is correctly aligned with its magnetic easy-axis perpendicular to the substrate plane. A careful choice of substrate and annealing parameters is required to recrystallize the as-deposited random fcc alloy to appropriately oriented L10.
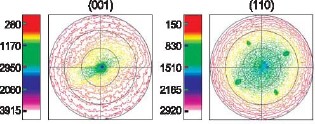
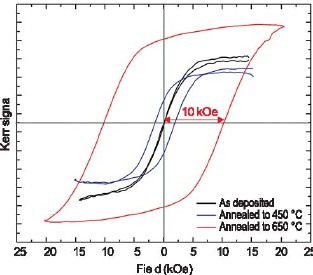
Figure 4: X-ray pole figures showing favorably oriented FePt L10. FePt electrodeposited onto a Cu (001) substrate has recently shown great promise. X-ray diffraction revealed the transition to L10 upon annealing, and X-ray pole figures indicated favorable orientations. Figure 4 shows FePt L10 (001) and (110) pole figures. The (001) figure indicates perpendicular orientation of the magnetic easy-axis (the c-axis), while the (110) figure indicates an in-plane texture. The in-plane texture is an added advantage, as it results in a narrower switching field distribution. Copper additions to the alloy have been found to lower the A1/L10 phase transition temperature by up to 90 oC. It may be speculated that interdiffusion of copper from the substrate during the anneal allowed the recrystallization to proceed from the interface with the substrate. It is likely that this would allow the film to replicate the orientation of the substrate. Magnetic hysteresis measurements performed using a Kerr magnetometer are shown in Figure 5. The magnetic coercivity of 10 kOe is comparable to figures quoted in the literature for vacuum-deposited FePt. It is believed to be the highest value reported for an electrodeposited film.
Figure 5: Magnetic hysteresis measurements showing a 10 kOe coercivity. Current efforts focus on controlling the interdiffusion between substrate and film to minimize loss of magnetization in the alloy, and on moving from planar films to through-mask deposited arrays of FePt pillars. For More Information on this TopicW.F. Egelhoff, Jr. (Metallurgy Division, NIST); E.B. Svedberg (Seagate Research, Pittsburgh) Back to Top
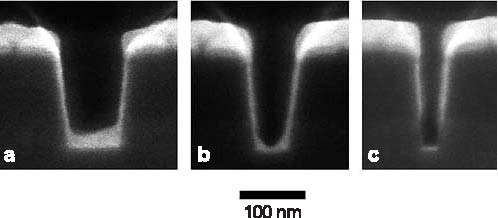
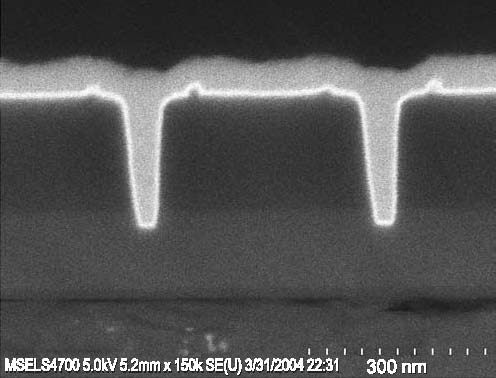
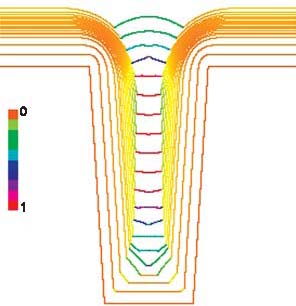
On-Chip Interconnects: Extending Performance of Sub-100 nm LinesConductors in on-chip metallizations are now reaching dimensions so small that defective seed layers are impacting manufacturing yields, and electron scattering on surfaces and grain boundaries is reducing electrical transport in the buried wires. Our goal is to provide tools to overcome these barriers. Recent efforts have quantified sources of the increased resistivity in wires made of silver, the most conductive of all metals, demonstrated seedless processing routes for copper wires, and improved understanding and modeling of the superfill fabrication process. NIST Contact: Daniel Josell and Thomas P. MoffatThe steady reduction of transistor dimensions in integrated circuits has been accompanied by similar size reductions of the on-chip interconnects that carry electrical signals, pushing the industrial technology for copper seed deposition close to its limit for defect-free sidewall coverage. Defects in seed layers, which arise from limitations in existing sputter technology, lead to voiding during electrodeposition of the copper metallization. Additionally, with the dimensions of the copper wires in these metallizations now approaching the intrinsic mean-free-path length of the conduction electrons, scattering on the wire surfaces has begun to significantly reduce electron transport and, thus, the associated electrical conductance of the wires. With grains in these conductors similarly sized, a reduction is also to be expected from grain boundary scattering. While the penalty for both effects is increased power dissipation and reduced clock speed, the appropriate approach for mitigation requires quantitative determination of the relative sizes of the contributions. Technical DetailsA tri-layer titanium, palladium and silver seed (Figure 1) was shown to yield smooth, conductive surfaces for the electrodeposition of silver wires for the electrical properties study. The poor seed coverage that is visible toward the bottom of the smallest trench (Figure 1c) is a technical challenge noted in the International Technology Roadmap for Semiconductors. Such seed defects motivated the “seedless” ruthenium barrier-based process detailed in last year’s report and continued by this year’s demonstration of seedless copper superfill in trenches with ruthenium or iridium barriers (Figure 2) deposited by perfectly conformal atomic layer deposition (ALD).
Figure 1: Ti/Pd/Ag seed layer in sub-100 nm deep trenches.
Figure 2: Trenches containing copper that was electrodeposited directly on an ALD iridium barrier (thin bright layer).
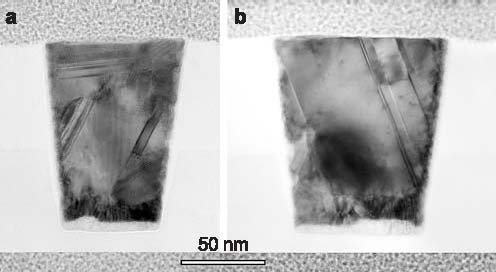
Figure 3: Cross-section views of silver wires fabricated by electrodeposition in the seeded trenches followed by removal of the metal from the field (transmission electron microscope). For the electrical studies, silver wires (Figure 3) were fabricated by silver electrodeposition on the tri-layer seeds (Figure 1), using a superfill process developed in the Metallurgy Division, followed by removal of the metal in the field adjacent to the wires through chemical– mechanical planarization and ion polishing.
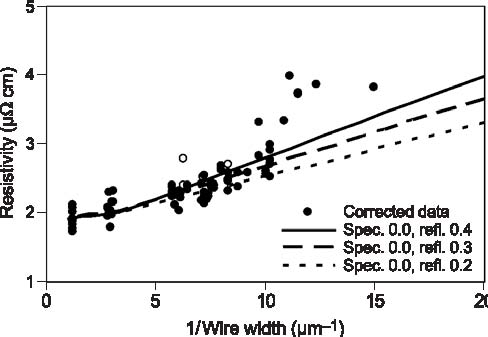
Figure 4: Electrical resistivities of 300 nm tall silver wires compared to predictions that account for surface scattering with varying amounts of grain boundary scattering. Resistivities for wires less than 100 nm wide are impacted by defects. The wires were studied in a standard four-point probe geometry that permitted measurement of wire resistances. Resistivities, obtained from the resistances using measured wire dimensions, increased significantly with decreasing wire width (Figure 4). To assess the origin of the resistivity increase, the Fuchs–Sondheimer analysis for diffuse scattering of electrons on surfaces was extended to permit analysis in the presence of both specular and diffuse scattering. The resulting equations, along with a previously published equation for grain boundary scattering, permitted quantitative evaluation of the experimental data. Significantly, modeling of the data showed that the increase of resistivity with decrease of wire size arises as much from scattering on grain boundaries as from scattering on the wire surfaces. This indicates that efforts to mitigate size effects must increase grain size as well as surface specularity if they expect to be more than modestly successful. The continuing industrial need for predictive simulation of feature filling spurred experiment and modeling of the superfill process itself. Consumption of adsorbed accelerator, a detrimental deviation from the surface segregation behavior that is responsible for the superfill process, was measured. Inclusion of such consumption in our Curvature Enhanced Accelerator Coverage (CEAC) model and computer code have made the filling predictions even more accurate. This research has continued to impact industry, indicated by requests for our superfill code from Intel, Applied Materials, ST Microelectronics, and ATMI; an invited article on superfill in the IBM Journal of Research and Development; and invited presentations given at Cookson–Enthone, in addition to publications and presentations at conferences.
Figure 5: Simulations of superconformal feature filling now account for consumption (incorporation) of adsorbed catalyst. Selected Project Publications for FY2004T.P. Moffat, D. Wheeler, M. Edelstein and D. Josell, “Superconformal Film Growth: Mechanism and Quantification,” IBM J. Res. and Dev., in press. D. Josell, C. Burkhard, Y. Li, Y.-W. Cheng, R.R. Keller, C.A. Witt, D. Kelley, J.E. Bonevich, B.C. Baker, T.P. Moffat, “Electrical Properties of SuperfilledSub-Micrometer Silver Metallizations,” J. Appl. Phys. 96 (1), 759–768, (2004). D. Wheeler, T.P. Moffat, G.B. McFadden, S. Coriell and D. Josell, “Influence of Catalytic Surfactanton Roughness Evolution During Film Growth,” J. Electrochem. Soc. 151 (8), C538–C544, (2004). T.P. Moffat, D. Wheeler, and D. Josell, “Electrodeposition of Copper in the SPS-PEG-Cl Additive System: I. Kinetic Measurements: Influence of SPS,” J. Electrochem. Soc. 151 (4), C262–C271, (2004). W.J. Evans, D.G. Giarikos, D. Josell, and J.W. Ziller, “Synthesis and Structure of Polymeric Networks ofSilver Hexafluoroacetylacetonate Complexes of THF, Toluene, and Vinyltrimethylsilane,” Inorg. Chem. 42, 8255–8261, (2003). For More Information on this TopicD. Josell, T.P. Moffat (Metallurgy Division, NIST); G. McFadden (Mathematical and Computational SciencesDivision, NIST); R.R. Keller, Y.-W. Cheng (Materials Reliability Division, NIST); C. Witt (Cookson–Enthone); C. Burkhard, Y. Li (Clarkson University); D. Wheeler (University of Maryland); T.K. Aaltonen, M. Ritala, M. Leskelä (University of Helsinki, Finland) Back to Top
The Structural Steel of the World Trade Center TowersIn August of 2002, NIST took responsibility for the investigation of the World Trade Center disaster. The investigation objectives include determining: whythe buildings collapsed; the procedures and practicesused in the design, construction, operation andmaintenance of the buildings; and areas in codes and practices that warrant revision. The eightinterdependent projects include Project 3 — Analysis of Structural Steel, led by the Materials Science andEngineering Laboratory. The objective of the project is to determine and analyze the properties and quality of the steel, weldments, and connectionsfrom steel recovered from the World Trade Center. NIST Contact: Stephen W. Banovic, Richard J. Fields, Timothy J. Foecke, William E. Luecke, J. David McColskey, Christopher N. McCowan, Thomas A. Siewert, and Frank W. GayleIn terms of the steel used, the World Trade Center was very complex. Plans called for steels of fourteen different yield strengths between 36 ksi and 100 ksi. Many of these steels were proprietary and were not supplied to any existing ASTM specification. To further complicate matters, four different fabricators providedsteel for the upper stories, and each used steel from more than one supplier. Most of the records that documented the steel actually used were either notpreserved or destroyed in the collapse. The MSEL Metallurgy and Materials Reliability Divisions have determined properties of the steel recovered from the WTC site and characterized failure modes associated with pre-collapse damage. This information has been provided for use in models of the building response to airplane impact and fire. In 2004, all major tasks were completed. Task 1 — Collect and Catalog Physical EvidenceThe Structural Engineers Association of New York (SEAoNY), later supplemented by NIST personnel, spent countless hours selecting steel in the New Jersey recycling yards for later forensic analysis. After shipment to NIST, the Metallurgy Division cataloged the 236 recovered steel components. Since many pieces were stamped and painted with unique serial numbers correlated with the building plans, it was often possible to identify the exact original location in the building. As a second part of this task, we also researched contemporaneous construction documents and steel specifications. This task helped identify steel suppliers and fabricators, as well as material substitutions. Task 2 — Categorize Failure Mechanisms Based on Visual EvidenceThe damage to the steel components of the buildings represents an important check on the accuracy of the fire and impact modeling, with the caveat that the recovered steel could have been damaged before the collapse, during the collapse, or during the salvage efforts.
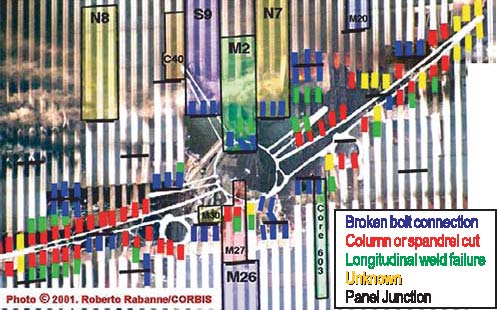
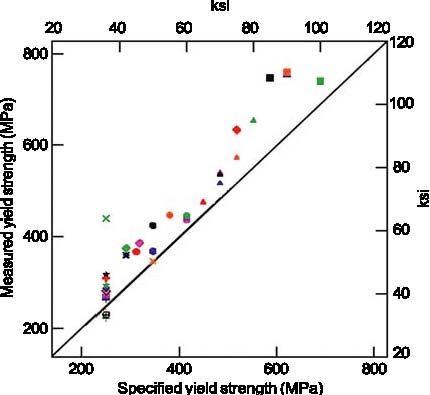
Figure 1: Enhanced image of the impact zone has allowed determination of failure modes in the perimeter columns. An outline of the plane is superimposed. Steel panels recovered for the investigation are highlighted in color. Image enhancement techniques were used to study photographs of the impact zones of the towers to establish the failure mechanisms of the perimeter columns. By making montages of many different images, it was possible to produce a nearly smoke-free, composite view of the columns that the aircraft struck. The columns failed by several different mechanisms. One important result was the demonstration that several key impact-zone columns in the NIST inventory were damaged primarily in the aircraft impact, and not in the subsequent collapse or recovery efforts. Figure 1 is a map of the impact zone of WTC 1 that illustrates the nature of the damage to the individual columns. Tasks 3 & 4 — Determine Steel Properties to Support Airplane Impact and Structure Performance Studies; Correlate Properties with Those Specified in the ConstructionOne important part of this task was to assess the quality of steel and determine whether it met the original specifications. In support of this goal, the group conducted more than 200 room-temperature tensile tests on samples from 39 different building components, which represented all the steels relevant to the investigation. Tests indicate that the steels generally met or exceeded the specified minimum strengths (Figure 2).
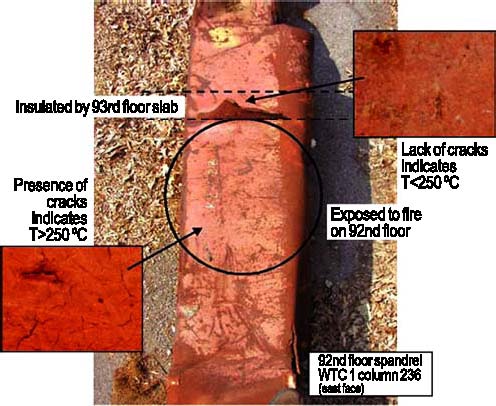
Figure 2: Yield strength — measured vs. specified minimum. The few anomalous data can be attributed to damage incurred in the collapse that removed the yield point behavior, or to the natural and accepted strength variability of structural steel. Steel specifications also regulate the chemical compositions. More than 350 different specimens, representing nearly every relevant steel component in the building, were analyzed for chemical composition and all of the sections relevant to the investigation. The chemical analysis helped confirm archival information that an American steel mill supplied steel for parts of the perimeter columns. The analyses also support the conclusion that the steels in the buildings met the specifications called for in the building plans. The strength of steel increases as the deformation rate increases. Accurately modeling these rate effects is essential for estimating the energy and momentum of the aircraft remnants which damaged the core columns. To establish the strain rate sensitivity of the relevant steels, we have conducted more than 100 tests on specimens from both the perimeter and core columns at rates up to 2000 s–1 (200,000 % deformation per second). Ultimately, the fires in the towers weakened the steel structure leading to collapse. We conducted more than 100 high-temperature tensile and creep tests to provide models of the deformation of structural steel at elevated temperatures for use in models of the building response to the fires. Task 5 — Analyze Steel to Estimate TemperatureJust as the nature of the deformation and failure of the recovered steel reveals information about the impact and collapse, the steel can also contain evidence of its exposure to the elevated temperatures in the fire. The situation is made more complex because much of the steel was also exposed to extended fires in the rubble before recovery. Several different methods, both conventional and novel, were examined for estimating high-temperature excursions seen by the steel. Only one method proved to be robust and easy to implement: paint on steels that reached temperatures over 250 °C cracked from the difference in thermal expansion between the paint and the steel.
Figure 3: Illustration of the method to establish the temperature excursions of recovered steel. The segment of the column protected by the floor slab remained at lower temperature. From photographs showing fire in windows, all recovered columns that may have been exposed to pre-collapse fire were identified and characterized using the paint crack technique. Figure 3 illustrates one of the columns that showed evidence of having exceeded 250 °C. OutputsOutputs for the project include parts of the June 2004 Progress Report on the World Trade Center Disaster (NIST SP 1000-5) and numerous memos for contractors that explain how to employ Project 3 data and deformation models. The final NIST investigation report will be released in the spring of 2005. For More Information on this TopicT.A. Siewert (Materials Reliability Division, NIST); F.W. Gayle (Metallurgy Division, NIST) Back to Top
|
|
|
|
Metallurgy Division of MSEL | metallurgy@nist.gov Home | Personnel | Research Opportunities The National Institute of Standards and Technology (NIST) is an agency of the U.S. Commerce Department. Privacy policy / security notice / accessibility statement / Disclaimer / Freedom of Information Act (FOIA) / No Fear Act Policy / ExpectMore.gov (performance of federal programs) / NIST Information Quality Standards |