
Materials Performance Group
Research Publication |
|
MULTIAXIAL MECHANICAL BEHAVIOR OF 63Sn-37Pb SOLDER
S.R.Low, III and R.J. Fields National Institute of Standards and Technology Mechanical Properties and Performance Metallurgy Division Gaithersburg, Maryland 20899
ABSTRACT
Solder joints are subjected to multiaxial stress and strain states, particularly near the constraining intermetallic layers known to form at the interface between solder and substrate. Predicting solderability and the mechanical performance of complex solder joints requires constitutive equations that relate multiaxial stressing to the mechanical response of the solder. To address this need, we have investigated the effects of uniaxial tension and pure shear on the elastic, plastic and fracture behavior of 63Sn-37Pb solder. Using standard tensile specimens, stress-strain curves were recorded at effective engineering strain rates between 0.0002 and 0.2 s-1. From these curves, Young's modulus, 0.2% offset yield strength, ultimate tensile strength and elongation to fracture were determined. Using similar torsion specimens, tests to examine shear behavior were conducted. From these tests, shear modulus, shear yield strength and ultimate shear strength were determined for effective strain rates between approximately 0.0001 and 0.02 s-1. Using the tension and shear results, comparisons with theoretical predictions of multiaxial behavior are made. Our key findings are: (1) we observe little or no effect of strain rate on Young's modulus or shear modulus; (2) the plastic properties (yield and ultimate strengths) in both tension and shear are strongly rate dependent and agree with the von Mises multiaxial yield theory; and (3) fracture behavior (e.g., ductility) is strongly rate dependent.
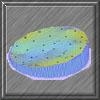
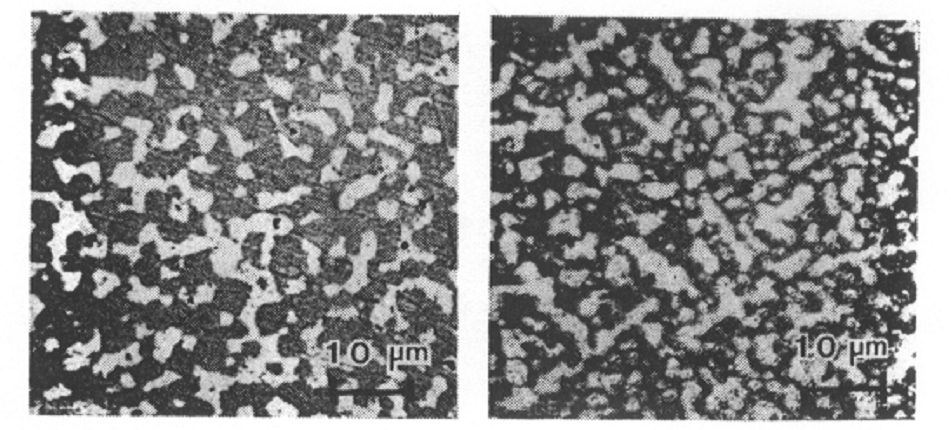
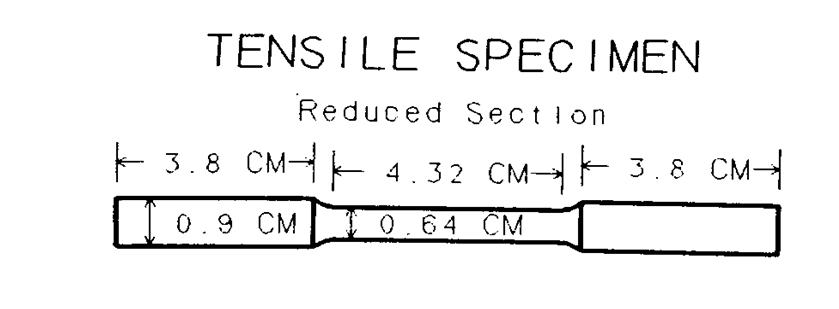
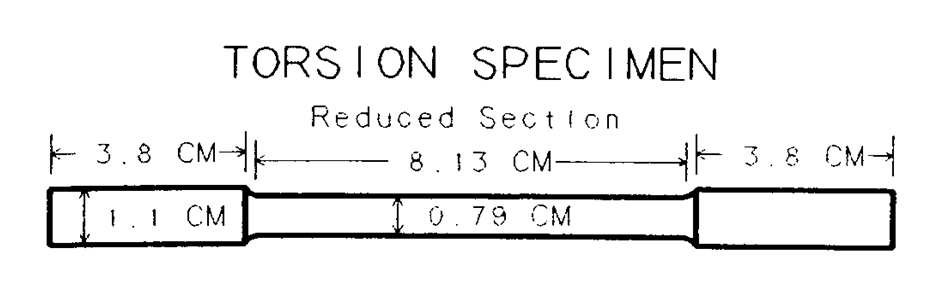
INTRODUCTION Solder joints in modern electronics are required for mechanical connections as well as to provide electrical and thermal conduction. Mechanical failure may result in a reduced ability of the joint to perform its other functions. In a joint, the solder is usually subjected to a variety of loading or straining rates, and temperature excursions. In response to these, the solder may deform elastically, plastically or even fracture. Even under simple loading conditions, multiaxial stresses and strains occur in solder joints. This is particularly true near the interface between solder and the constraining intermetallicreaction layers present in all joints. Research is underway to find out how these complex stress and strain states may reduce solderability and limit joint reliability. Since the stress-strain data reported in the literature is uniaxial, the present study was performed to establish a correlation between uniaxial behavior and the complex multiaxial behavior that occurs near the intermetallic layers. To predict the solder's behavior and avoid undesirable consequences, constitutive equations are needed that relate stressing (especially multiaxial stressing) to the mechanical response of solder used in microelectronics. In response to this need, a test program was established between Harry Diamond Laboratories and the National Institute of Standards and Technology (NIST) to study the effects of uniaxial tension and pure shear on the elastic, plastic and fracture behavior of 63Sn-37Pb alloy of solder. This paper reports the findings from the study. TEST CRITERIA Material and Test Specimens For this study, one-pound bars of ultrapure 63Sn-37Pb solder alloy meeting government specification FED SPEC QQ-S-571E were procured from a commercial source. The solder bars were formed by extrusion and immediately shipped through a distributor to NIST. After an initial aging period of seven days at room temperature (22 C), the bars were stored in a refrigerated environment below 0 C until used. This was done to avoid structure coarsening and loss of shear strength [1] at room temperature. In this storage condition the microstructure of the solder bars was similar to that found in a typical electronics solder joint. In figure 1, the test material microstructure is compared with the microstructure of an aged SMT (Surface Mount Technology) solder joint provided by the Solder Science Center in Crane, Indiana. The as-received solder bars measured approximately 1.9 cm by 2.5 cm by 25.4 cm long. From each of 15 bars, one torsion and two tensile specimens were produced by machining, resulting in 15 torsion specimens and 30 tensile specimens. The specimens were machined rather than cast in order to retain the microstructure of the solder bars. The dimensions of the tensile and torsion specimen types are shown in figures 2 and 3, respectively. The ends of both specimen types were machined round in order to grip the tensile specimens with wedge grips and the torsion specimens with three-jaw chuck grips. Both types of specimen were prepared using the same procedure. Initially, the bulk solder bars were rough cut by band-saw into pieces with square cross sections slightly larger than the final specimen end diameter. The square blanks were then rough machined round on a lathe. A property of this alloy of solder is that it will deform under a relatively minor stress at room temperature. It was found that a specimen would not retain its shape when machined on a lathe to a cross section as small as the reduced sections of these specimens. In addition, the cutting tool produced an unsatisfactory surface finish at room temperature. To overcome these problems, each rough cut round was cooled by submerging it in a liquid nitrogen bath. When its temperature equilibrated with the liquid nitrogen, the specimen was removed from the bath and immediately mounted into a computer controlled lathe. Visible frost quickly formed on the solder surface as a result of the extreme cold temperature of the specimen. Machining was started and continued until the frost that had formed on the solder surface completely melted away indicating that the surface had warmed above 0 C. The specimen was removed from the lathe and placed back into the liquid nitrogen bath. After recooling to liquid nitrogen temperature, the specimen was again removed from the cooling bath and mounted into the lathe. Machining was continued under computer control. This process was repeated until the final specimen dimensions, including the reduced section, were achieved. The finished specimens were stored in sand filled trays at 0 C until they were to be tested. The sand was used to fully support the specimens which, if unsupported, would tend to creep and deform under their own weight.
Test Procedures Tensile Tests: Uniaxial tensile tests were conducted on a vertical, screw-driven, universal testing machine having a fixed upper crosshead and a movable screw-driven lower crosshead. The load train consisted of a load cell attached to the upper crosshead from which was hung a self-aligning pull rod and the upper wedge grip. The lower wedge grip was attached to the lower crosshead. Each specimen was mounted in the wedge grips in a manner such that negligible force was applied to the specimen prior to testing. It is particularly important when testing this material that the specimen does not experience a preload because of the tendency of this alloy of solder to creep and deform under very minor tensile, compressive, or bending loads. Measurement of the applied tensile load was taken from the load cell and stored digitally by a data acquisition system sampling at two data sets per second. Specimen displacement was measured using a strain gage extensometer having a 2.54 cm gage length. The displacement measurements were also stored by the data acquisition system. When displacement approached the maximum range for the extensometer, it was removed from the specimen and displacement was computed from crosshead rate and time. The range of the extensometer was sufficient to allow data acquisition using the extensometer up to and beyond yielding. For nine of the tensile tests, load and displacement data were also acquired by a digital storage oscilloscope in parallel to the data acquisition system. A digital storage oscilloscope was used because of its high-speed data acquisition capability. High-speed data acquisition was required to adequately measure and resolve the elastic and yield behavior of this material, particularly when tested at the higher strain rates. Testing was conducted under crosshead speed control and at room temperature (22 C). Only 20 of the 30 tensile specimens produced were tested. From one to three specimens were tested at each of the following crosshead speeds in cm/minute: 0.051, 0.127, 0.254, 0.508, 1.27, 2.54, 5.08, 12.7, 25.4 and 50.8. Prior to testing, each tensile specimen was lightly indented with gage marks within the reduced section. The specimen was mounted carefully into the test machine grips and tested in tension until it failed. Torsion Tests: Fifteen torsion specimens were tested using the same universal testing machine as used for the tensile tests, but modified with torque and twist accessories. The arrangement for these tests involved using two three-jaw chuck grips, one attached to the test machine gearing at the machine base, and the second attached above the first on the bottom side of the lower crosshead. The upper grip also included a torque cell for measuring the applied torque. The system is designed such that the upper end of the torsion specimen is held fixed in the upper-grip / torque-cell assembly, and the lower end of the specimen is held in the lower grip which floats on a spring system in order to remove any tensile load on the specimen. Torque is applied to the specimen by rotation of the lower chuck grip. Torque was measured using the torque cell in the same manner in which load was measured for the tensile tests. The angle of twist was measured by two methods. To measure the initial specimen twist which included the elastic and yield portions of the test, a troptometer with a 5.08 cm gage length was attached to the specimen. A troptometer was required to adequately resolve the elastic and yield behavior occurring at the onset of testing. Two drawbacks of the troptometer are that it is designed with only a limited range of rotation, and it is attached to the specimen with sharp-point set screws. Tests using this instrument were conducted only to a point beyond yielding at which time the test was stopped. The limited range of the troptometer prohibited using it to test a specimen to failure. For these tests time and twist speed were used as the basis for measuring rotation angles. Also, different specimens had to be tested than were used for the troptometer measurements because of the indents caused by the set screws. For the tests to failure the specimen was twisted under a constant rotation rate until the specimen failed into two parts. In this study, seven specimens were tested using the troptometer, and the remaining eight were tested to failure. Tests were conducted at room temperature (22 C) and at each of the following machine rotation rates in revolutions/minute: 0.053, 0.133, 0.267, 0.533, 1.33, 2.67 and 5.33.
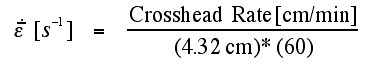
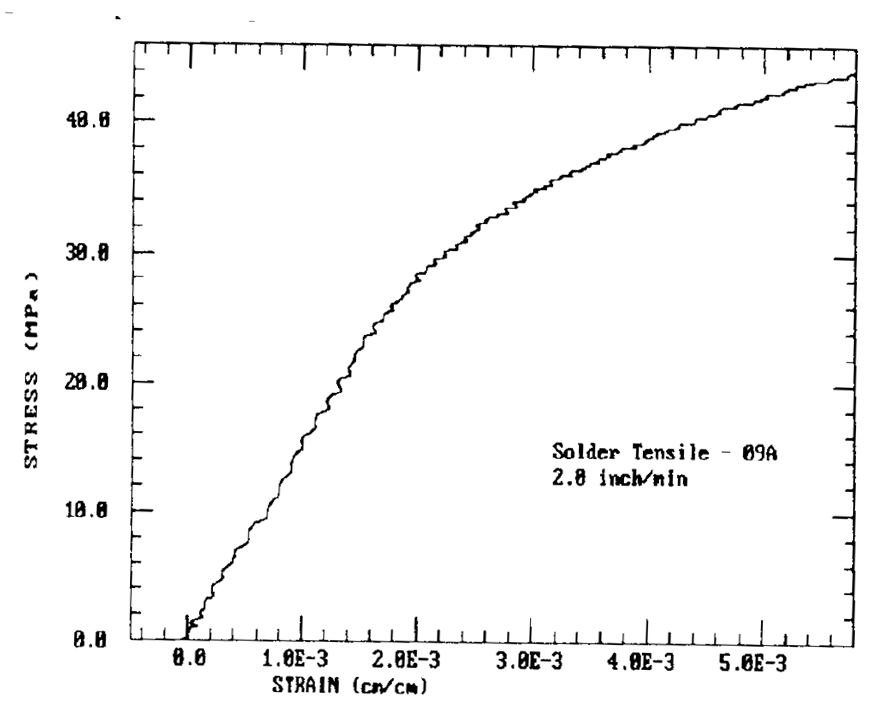
RESULTS Tensile Tests Results For the 20 tensile tests conducted, the digitized load and displacement data were converted to stress and strain to create corresponding stress-versus-strain plots. In this study stress and strain values are reported as engineering stress and strain. In the elastic and early plastic regions however, where moduli and yield strengths in tension and shear are measured, engineering stress and engineering strain can be considered essentially equivalent to true stress and true strain. A typical tensile stress-strain plot is shown in figure 4 with an expanded view of the elastic and yield portions of the test. From these data the following property values were calculated: Young's modulus, 0.2% offset yield strength and ultimate tensile strength. For the tests in which data were acquired with the slower data acquisition system that sampled at 2 data sets per second, only a value for ultimate tensile strength could be resolved. For the tests in which data were also acquired with the digital oscilloscope, values for Young's modulus and yield strength were easily calculated. In addition to the property values calculated from the stress-strain plots, percent elongation was also calculated from direct measurements of the distance between specimen gage marks before and after testing. Since the tensile tests were conducted using a constant crosshead speed, the instantaneous strain rate was not constant during the test. However, the elastic and yield regions of the test occurred at the onset of testing with only a small amount of strain having taken place. The strain rate during this portion of the test can be considered constant and approximated by dividing the crosshead speed by the length of the reduced section of the specimen. The length of the reduced section was measured to be 4.32 cm. This relationship for the effective engineering strain rate (
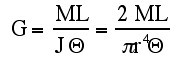
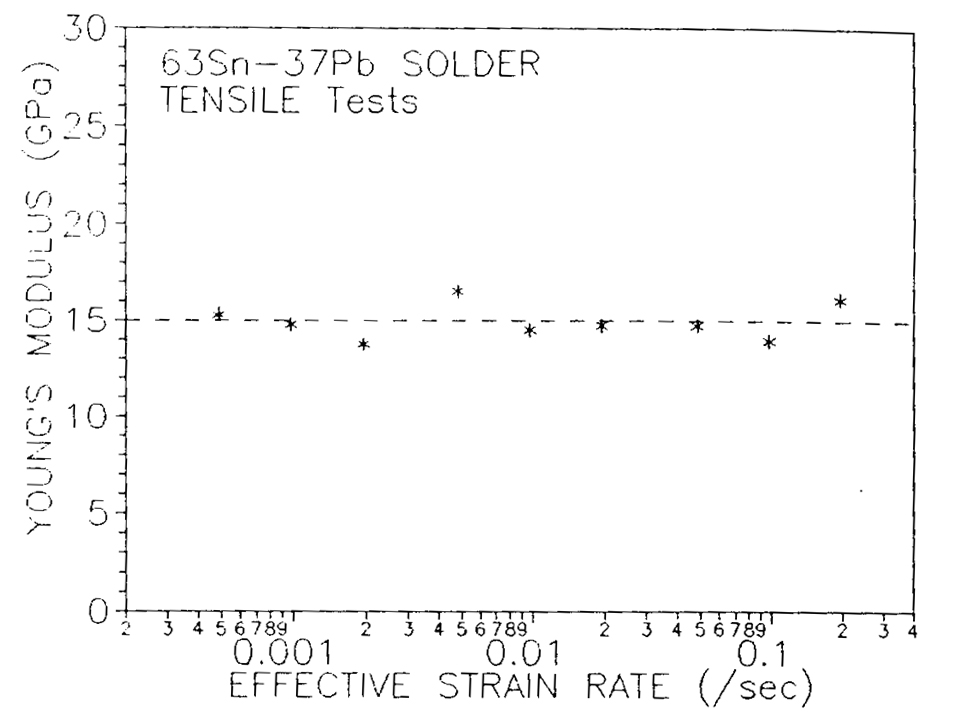
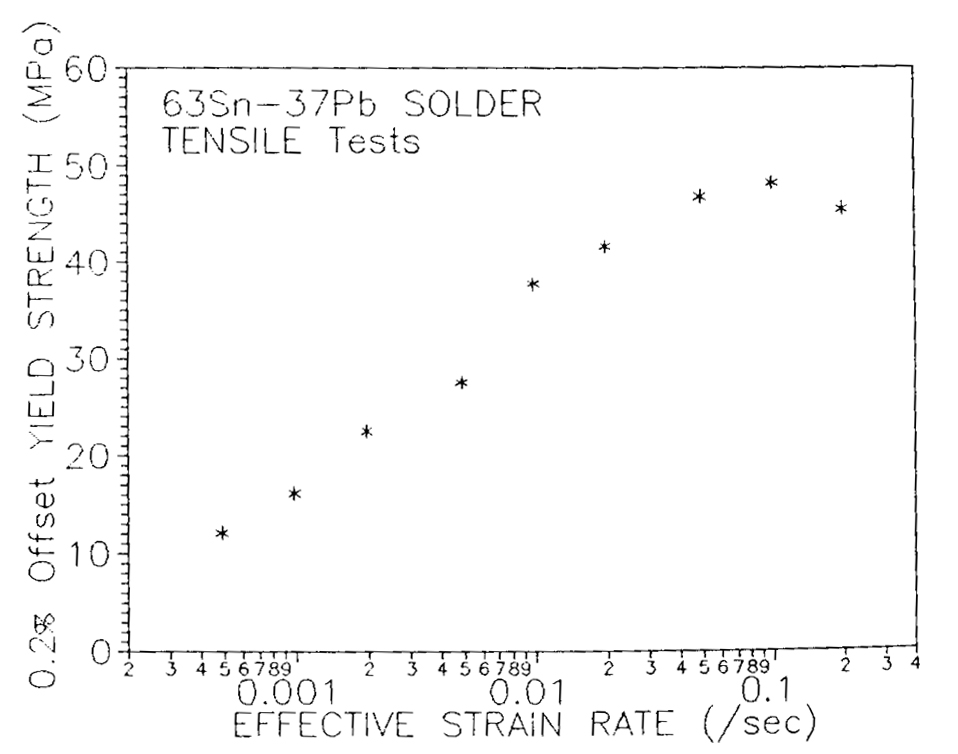
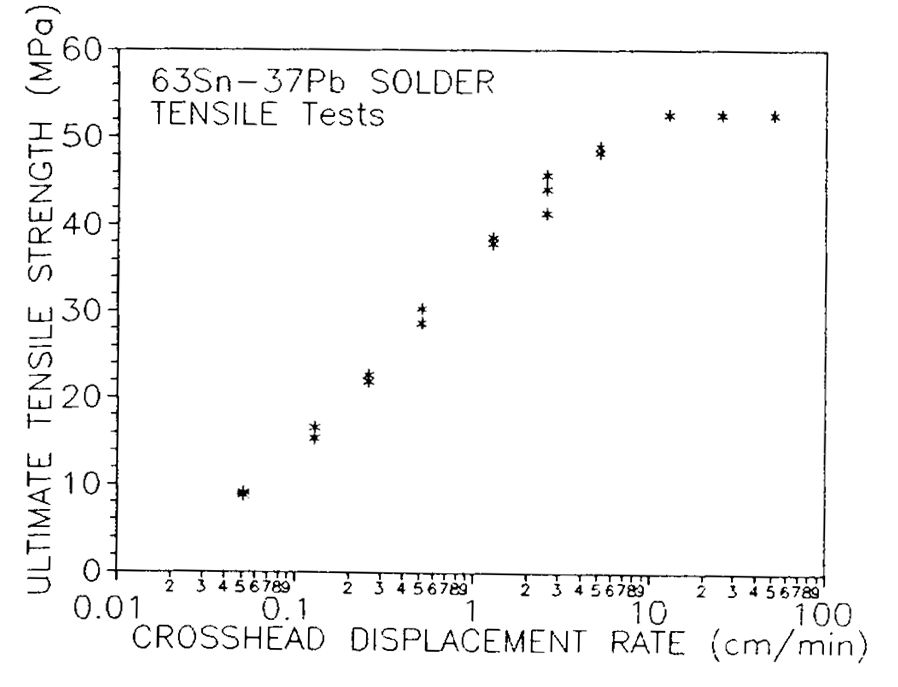
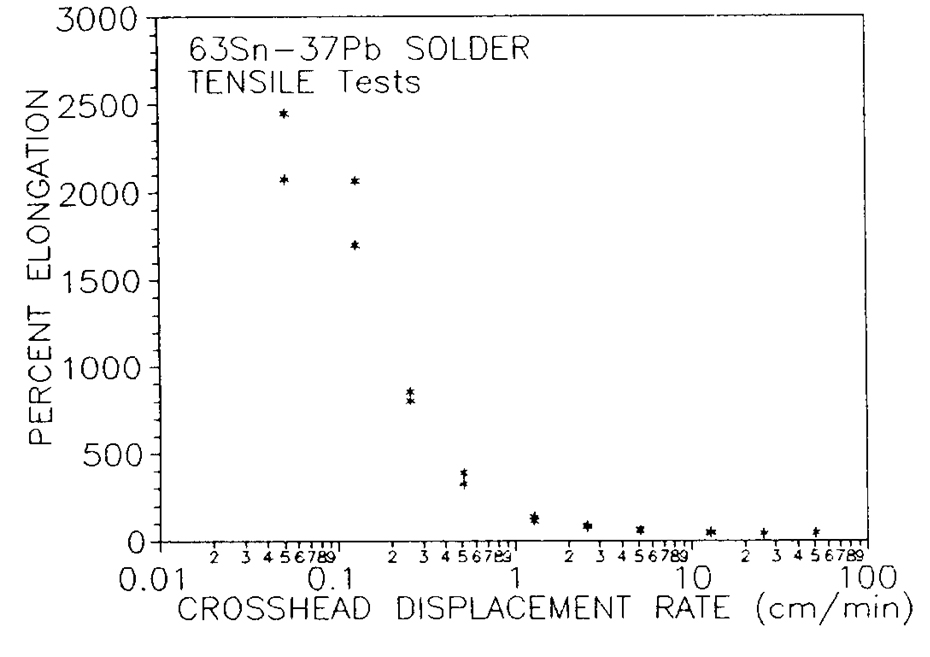
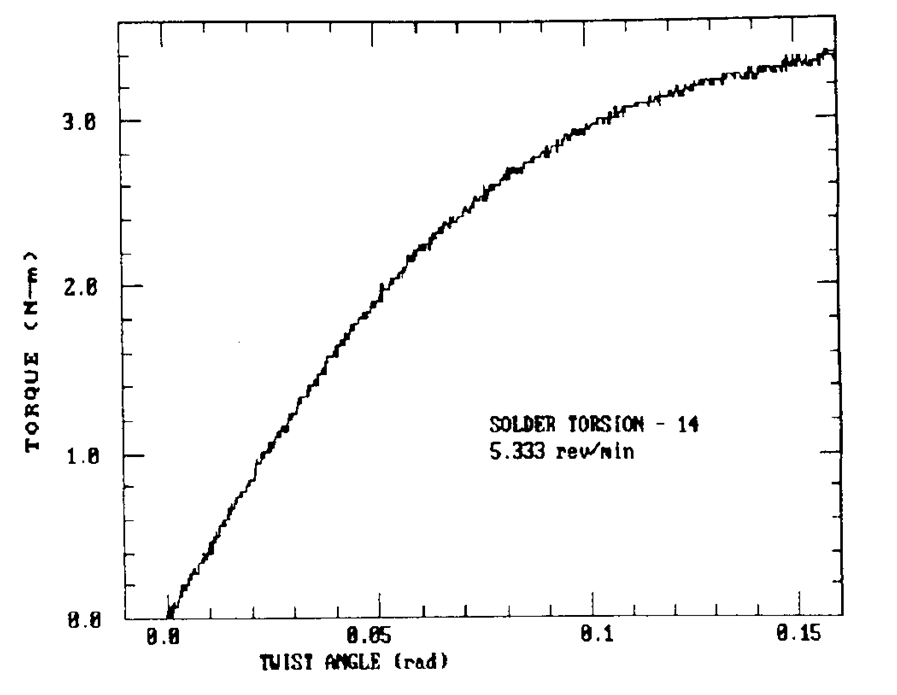
Effective strain rates [s-1] corresponding to the respective crosshead displacement rates given above are as follows: 0.0002, 0.0005, 0.0010, 0.0020, 0.005, 0.010, 0.020, 0.05, 0.10 and 0.20. Young's modulus was calculated by measuring the slope of the initial linear region of the stress-strain plot. In figure 5, Young's modulus is plotted as a function of effective strain rate. These data show that for this 63Sn-37Pb solder alloy, there is no apparent effect of rate on Young's modulus. The average value of the nine measurements of Young's modulus is 15.0 GPa. Figure 6 shows that tensile yield strength, which was calculated using a 0.2% strain offset, is strongly dependent on strain rate. Similarly, figures 7 and 8 indicate that ultimate tensile strength and percent elongation are strongly dependent on crosshead displacement rate. Note that in figure 8, the plot of percent elongation versus rate shows that at the slower rates tested, this alloy exhibits superplasticity with extremely large elongations of over 2000%. Torsion Test Results The torsion tests provided digitized torque and twist data for each of the rotation rates that were tested. Figure 9 shows a typical torque-versus-twist plot from data acquired using the troptometer. It is a view of the elastic and yield portions of a test. These results indicate that the onset of yielding occurred early in the test. This made identification of the elastic portion of the torque-twist curve more difficult to resolve than for the tensile tests. As a result, we feel that calculation of the shear modulus may be subject to a higher measurement error and thus more scatter than the calculation of Young's modulus. The shear modulus (G) can be expressed in terms of the specimen geometry, the torque (M), and the angle of twist (Q)[2]. This relationship is
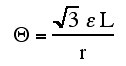
where J = πr4/2 is the polar moment of inertia for a solid cylindrical specimen, r is the specimen radius and L is the gage length of the troptometer. Shear modulus can be calculated from the torque-twist plots by measuring the slope of the initial linear portion of the curve and substituting this value for M/Q in equation 2. In order to compare shear yield strength and tensile yield strength data, an equivalent effective strain offset had to be used in both cases when calculating yield strength. Recall that for the tensile test analysis a 0.2% offset was used. Thus an equivalent 0.2% strain offset should be used in the shear analysis. A strain offset can be derived in terms of an angle of rotation as follows. For small angles of rotation, outer fiber shear strain (g) is given by [2]
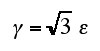
Shear strain (g) can also be expressed in terms of effective tensile strain (e) by [2]equation 4
Combining equations 3 and 4 yields
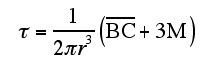
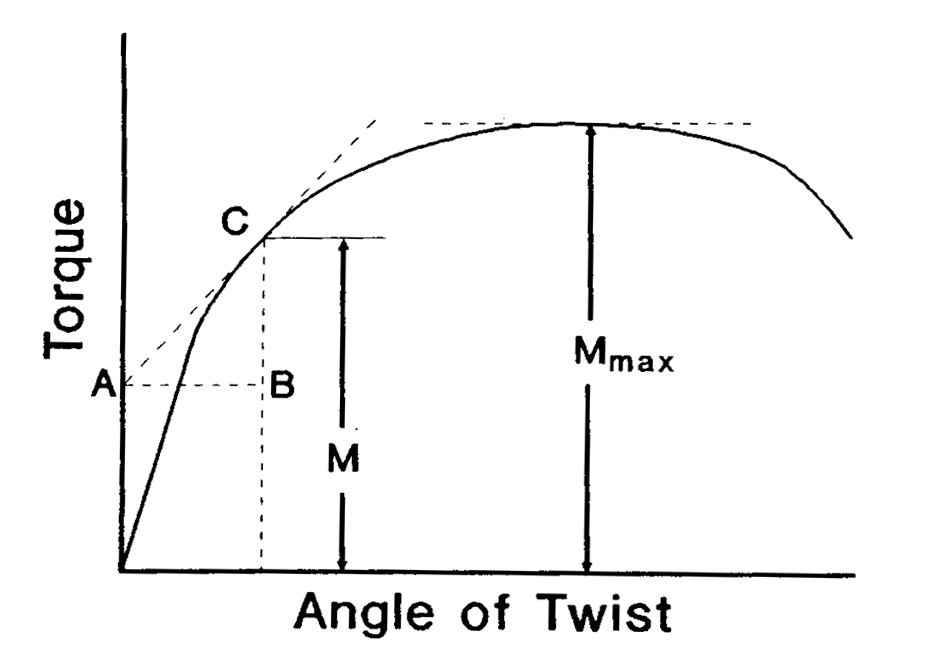
For the dimensions of the torsion specimens tested and a tensile strain of 0.002,the equivalent strain offset in shear calculates to 0.044 radians. Nadai [3] gives a method for calculating the shear stress of a solid cylinder from a torque-twist curve. Figure 10 illustrates the yield region of a torque-twist curve. By using figure 10 and the following relationship for shear stress (t)
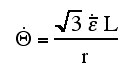
a value for shear yield stress (ty) can be calculated at an offset of 0.044 radians for specimens tested at each twist rate. Twist rate can be converted to an effective strain rate by using equation 5 restated in terms of rates,
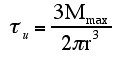
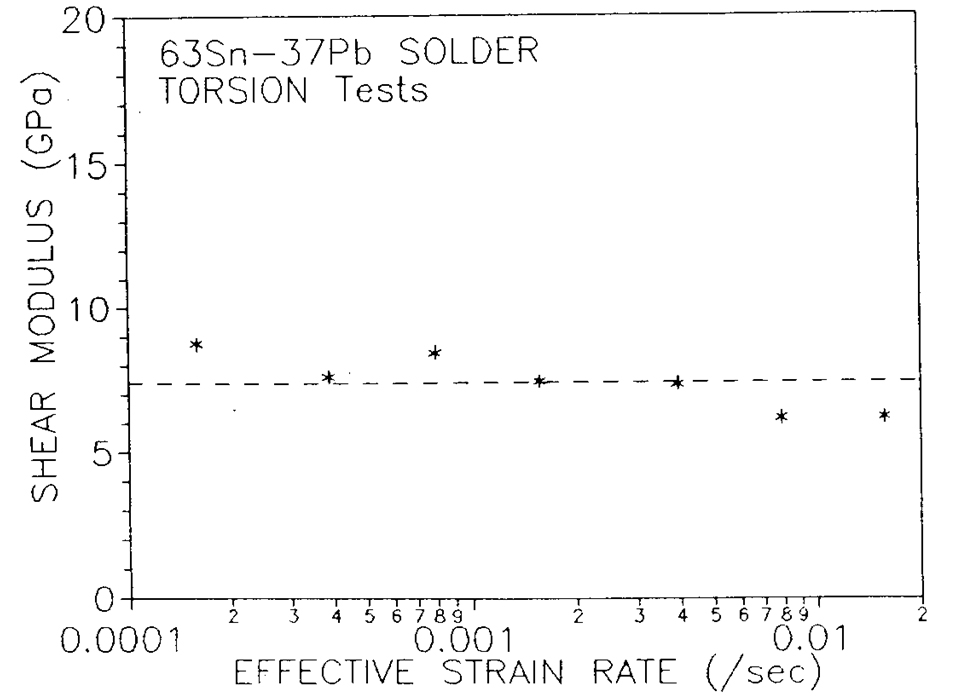
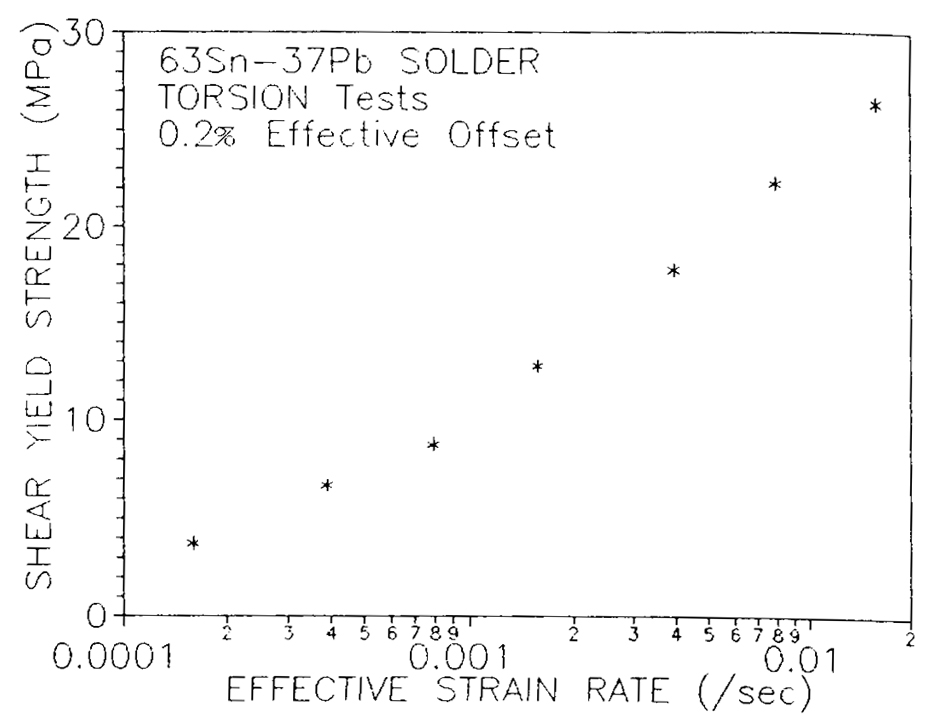
and solving for Shear modulus versus effective strain rate is plotted in figure 11. This figure indicates that modulus in shear may exhibit some dependence on strain rate contrary to the case for Young's modulus. However, as was mentioned above,this measurement of shear modulus is more prone to error and scatter. The apparent rate dependence could therefore be within the scatter band of the test. The shear modulus averages to a value of 7.4 GPa for these measurements. Shear yield strength however, as shown in figure 12, is strongly dependent on strain rate as was the tensile yield strength. From the tests to failure, the ultimate shear strength (tu) was calculated from the maximum torque (Mmax)using the following relationship [2]
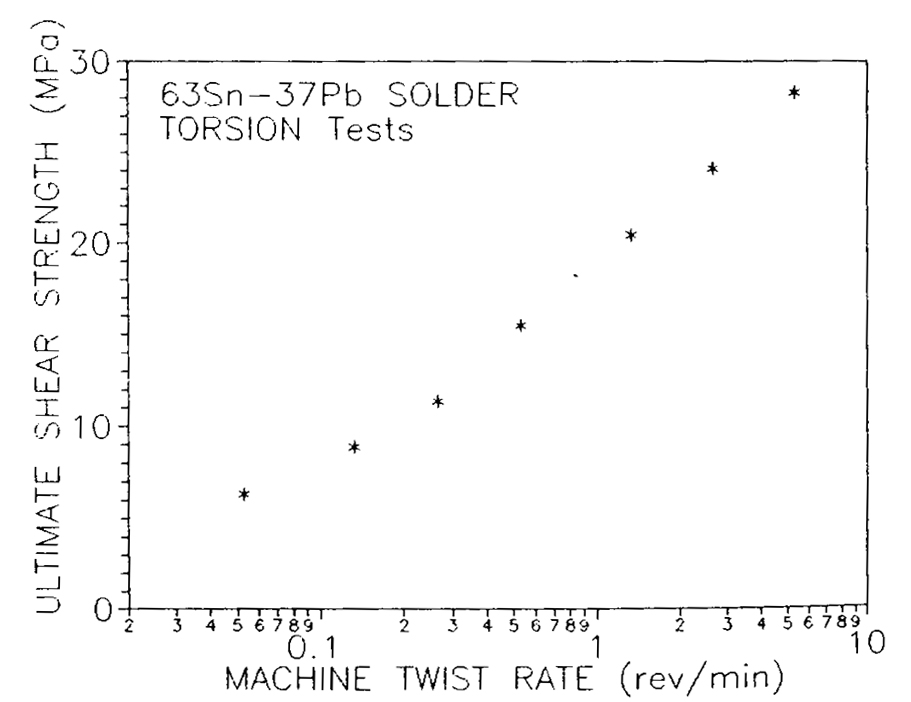
Ultimate shear strength versus twist rate is plotted in figure 13. As observed for the ultimate tensile strength, ultimate shear strength is strongly dependent on rate.
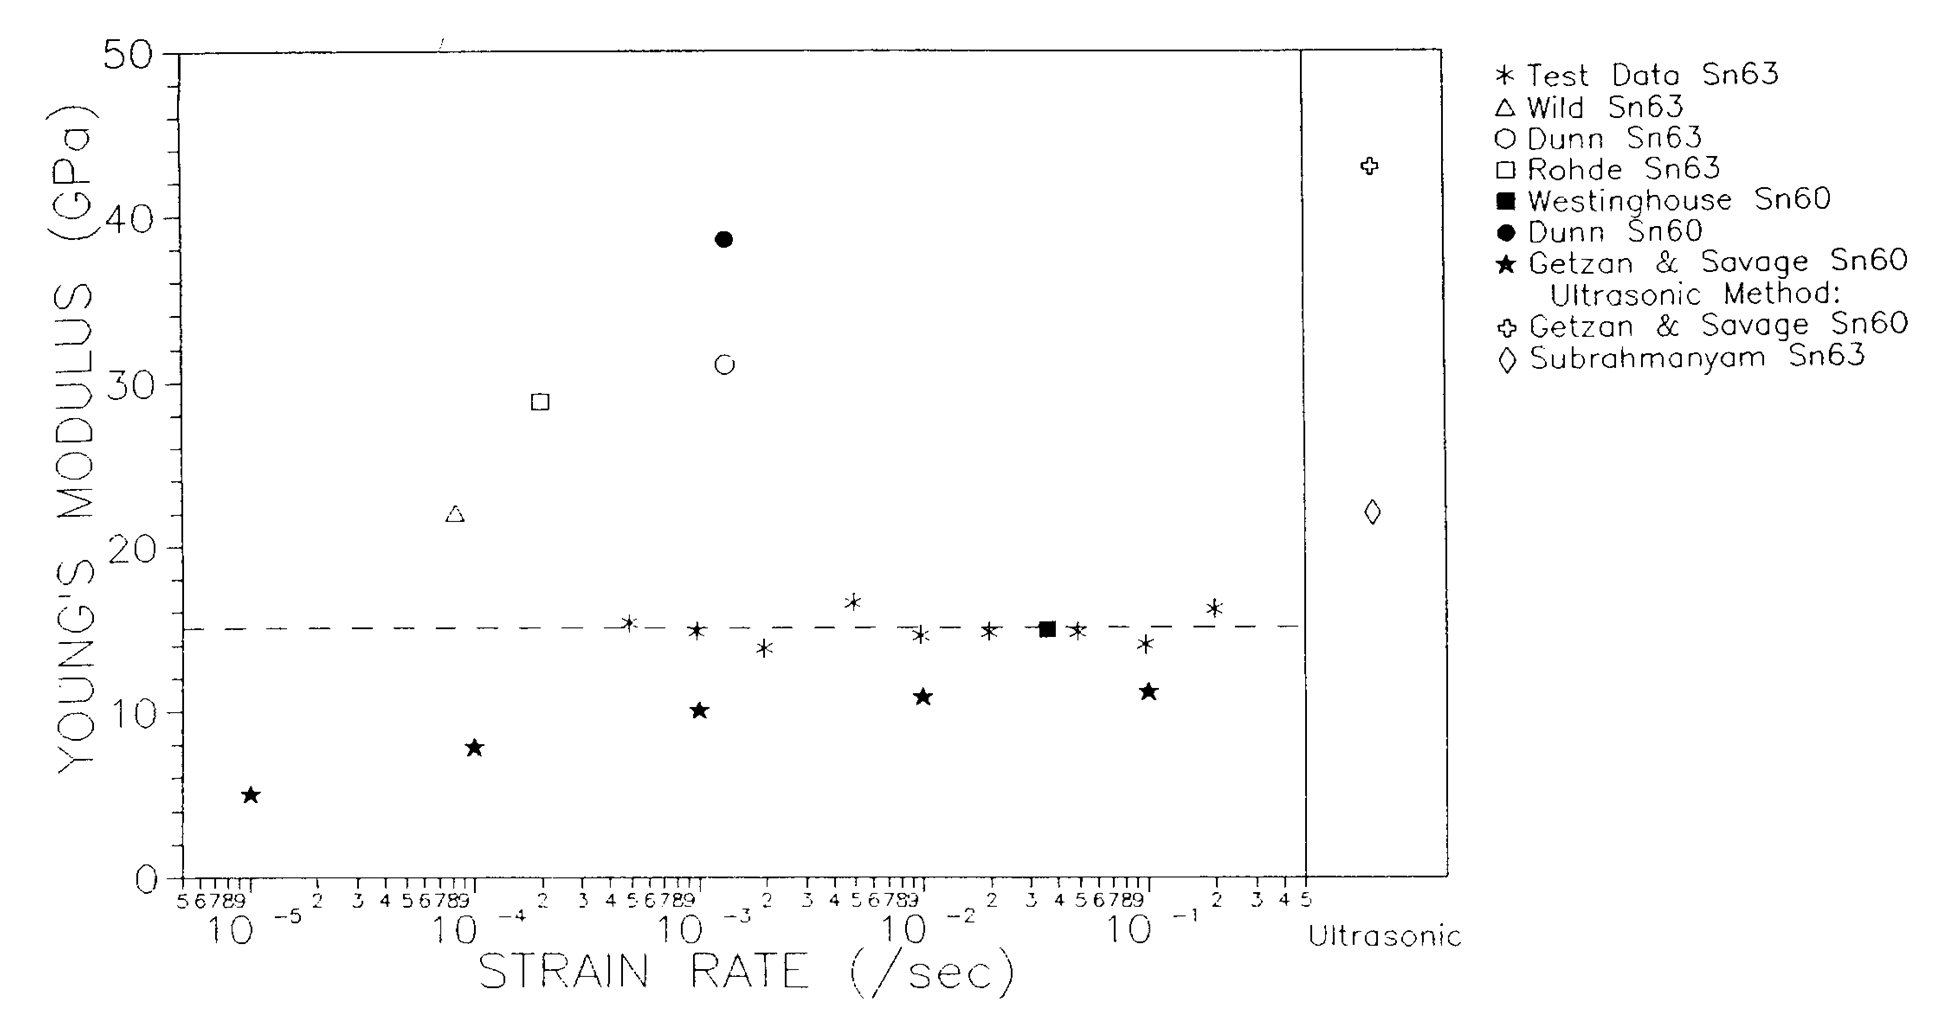
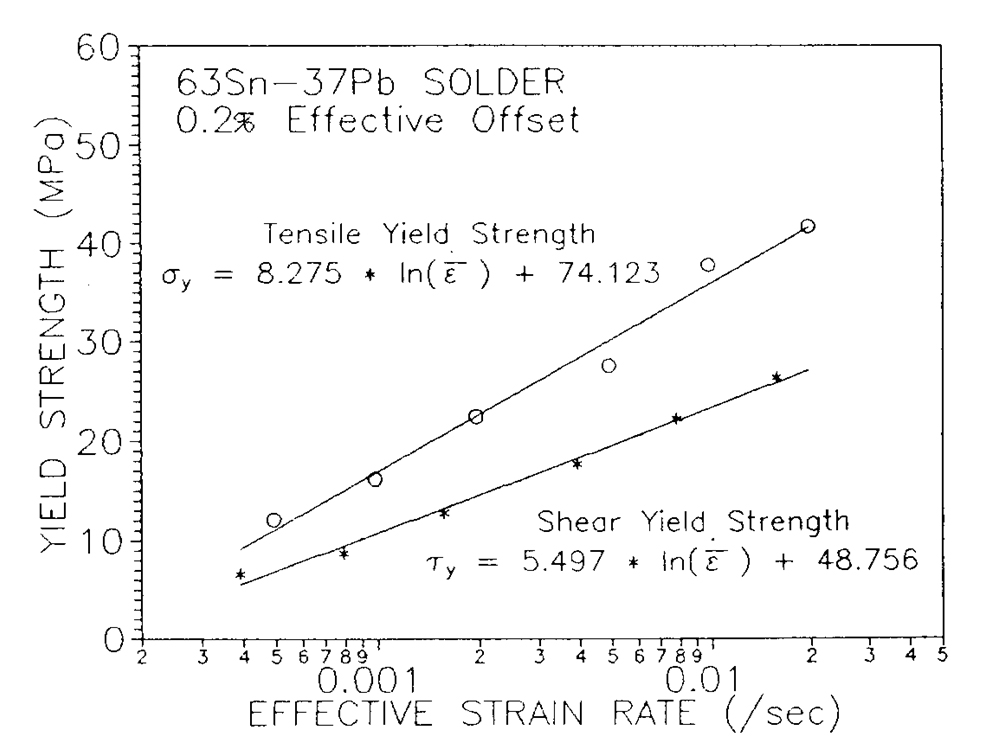
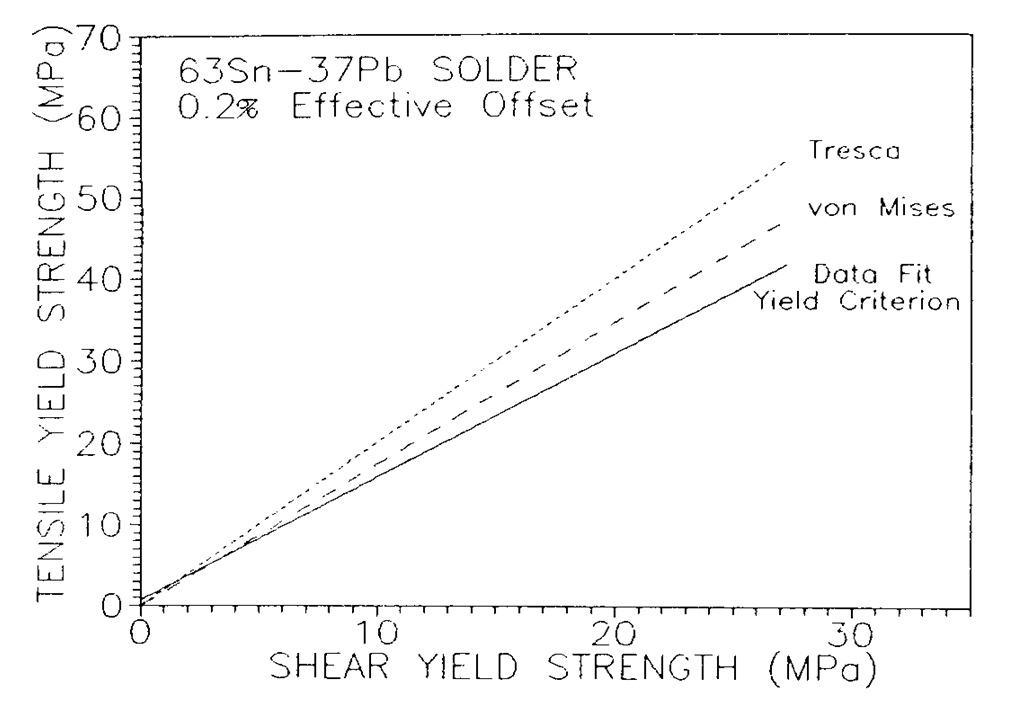
DISCUSSION Asa basis for comparison, we also include figure 14, a plot showing roomtemperature Young's modulus versus strain rate, comparing our findings with 63Sn-37Pb and 60Sn-40Pb data reported in the literature [5,6,7,8,9,10]. There are large differences among the reported findings, although our data closely agree with the Westinghouse data [5]. In addition to the wide range of reported Young's modulus values, the Getzan and Savage [8] data also suggest that Young's modulus is rate dependent. The strongest indication of a rate dependence however, occurred at rates below the range of our test data. A possible reason for the differences in results may be that in the Getzan and Savage work, the initial linear region of the elastic portion of the test curve could not be resolved. As a result, a chord modulus was calculated for Young'smodulus. A measurement of a chord modulus would give a lower value than the actual slope of the elastic data as their results indicate. Without measuring the actual Young's modulus from the elastic portion of the curve, a rate dependence becomes more difficult to determine. An additional area of interest is this solder material's multiaxial yielding behavior. This behavior can be shown by plotting the measurements of tensile yield strength against the measurements of shear yield strength. In order to compare the tensile and shear data, yield strength values for tension and shear must reflect the same strain rates. The method used to accomplish this was to use only the tensile and shear yield strength data where there were comparable strain rate measurements. A logarithmic fit of each of these two data subsets was made, as illustrated in figure 15. Plotting the fit of the tensile data versus the fit of the shear data gave a relationship for predicting when plastic yielding begins for this solder alloy. This relationship is plotted in figure 16 and compared with two theoretical, von Mises' and Tresca's [4], criteria for the onset of yielding in a ductile metal. The von Mises criterion predicts that yield stress (ty)in shear is related to uniaxial tensile yield stress (sy) by equation 9.
vonMises:
The Tresca criterion predicts this relationship by equation 10.
Tresca:
As shown in figure 16, our data more closely agree with the von Mises criterion for multiaxial yielding. The discrepancy between our data and the theoretical prediction may be explained by cavitation effects in tension which have been observed in solder [11]. Under a tensile stress, voids form early in the deformation of this solder alloy, and fracture occurs. This would cause an apparent lower tensile yield stress for a corresponding shear yield stress than would be exhibited in a material in which cavitation did not occur. A tensile yield stress versus shear yield stress plot of a material in which such cavitation occurs will have a shallower slope as was indicated for this material in figure 16. The closer agreement of the data with the von Mises criterion offers a benefit to design engineers. As is well known [12, 13], the Tresca yield criterion can be represented by a hexagonal shape which describes a yield surface having sharp vertices. In contrast to the smooth elliptical shape of the von Mises yield surface, the sharp vertices described by the Tresca criterion create mathematical difficulties for finite element analyses. Furthermore, the von Mises criterion allows the derivation of equations relating the principal stresses or strains to the effective stress or strain as shown by Faupel [12]. Similar relationships exist for arbitrary coordinate systems [13]. The practical advantage of the applicability of thevon Mises criterion is that the effective stress-strain curve for a material is the same as the uniaxial stress-strain curve, which is most commonly reported in the literature. Using the effective stress or strain concept, the stress-strain curve for any arbitrary multiaxial state can be deduced from the uniaxial curve. Therefore, validation of the effective stress and strain concept, such as presented here, makes this vast body of uniaxial information of much greater value to the engineer trying to improve solder joint technology.
CONCLUSION We have presented the results of mechanical property measurements for 63Sn-37Pb solder alloy. The data indicate that for this alloy, Young's modulus exhibits no dependence on strain rate. Shear modulus exhibits little or no dependence on strain rate. These elastic properties have average room temperature values of 15.0 GPa and 7.4 GPa, respectively. Each of the other measured mechanical properties, yield strength in tension and shear, ultimate strength in tension and shear, and elongation to failure in tension, all exhibited a strong rate dependence. The data also suggest that the multiaxial yielding behavior of this solder alloy more closely follows the von Mises theory for plastic bodies. We have compared our measurement of Young's modulus with data reported in the literature. Although there is agreement between our data and some reported measurements, there exists a wide range of reported values. A discrepancy also exists concerning strain rate dependence of Young's modulus. The wide range ofreported values and the rate dependence discrepancy possibly may be explained by differing techniques including specimen preparation, testing and data analysis.
ACKNOWLEDGMENT The authors wish to thank Donald E. Harne for his assistance in preparation of the test specimens and for conducting the tensile and torsion tests. We would also like to thank Roland deWit for his help with the data analyses.
REFERENCES [1] B.T. Lampe, "Room Temperature Aging Properties of Some Solder Alloys," Welding Research Supplement, 55, October 1976, pp. 330-340. [2] G.E. Dieter, Mechanical Metallurgy, 2nd ed. McGraw-Hill, Inc, 1976, ch. 10, pp. 378-388. [3] A.Nadai, Theory of Flow and Fracture of Solids, 2nd ed., vol. I, NewYork: McGraw-Hill Book Company, 1950, pp. 347-349. [4] A.H. Cottrell, The Mechanical Properties of Matter. New York: John Wiley& Sons, Inc., 1964, pp. 312‑317. [5] "Development of Highly Reliable Soldered Joints for Printed Circuit Boards, Final Report, 28June 1967 - 28 June 1968,", Westinghouse Electric Corp., Baltimore, MD., Report # NASA-CR-98433, 1968. [6] W.Rohde and J. C. Swearengen, "Deformation Modeling Applied to Stress Relaxation of Four Solder Alloy," ASME Journal of Engineering Materials and Technology, 102, April 1980. [7] G.D. Dunn, "The Properties of Near-Eutectic Tin/Lead Solder Alloys Tested Between +70 and -60C and the Use of Such Alloys in Spacecraft Electronics," European Space Agency, Technical Memorandum ESA TM-162(ESTEC), September 1975. [8] G.D. Getzan and E. I. Savage, "60/40 Tin/Lead Behavior at Various Strain Rates and Temperatures," The Charles Stark Draper Laboratory Internal Report, CSDL-R-2187, October 1989. [9] R.N. Wild, "Effects of Gold on the Properties of Solids," IBM No. 69-25-2451, Oswego, N.Y., 1971. [10] B.Subrahmanyam, "Elastic Moduli of Some Eutectic Alloy Systems," Transactions of the Japan Institute of Metals, 13, 1972. [11] A. E.Geckinli and C. R. Barrett, "Superplastic Deformation of the Pb-Sn Eutectic," Journal of Materials Science, 11, 1976. [12] J. H.Faupel, Engineering Design. New York: Wiley and Sons, Inc., 1964, pp. 369-445. [13] F. B.Seely and J. O. Smith, Advanced Mechanics of Materials. New York: Wiley and Sons, Inc., 1952, pp. 76-94.
LIST OF FIGURES
Figure 1.(a) Microstructure of the solder test material. (b) Microstructure of an aged SMT solder joint. Figure 2. Tensile test specimen dimensions. Figure 3. Torsion test specimen dimensions. Figure 4. Expanded view of a typical stress-strain plot showing the elastic and yield regions of the test. Figure 5. Young's modulus of the 63Sn-37Pb test material as a function of effective strain rate. Figure 6. Tensile yield strength of the 63Sn-37Pb test material as a function of effective strain rate. Figure 7. Ultimate tensile strength of the 63Sn-37Pb test material as a function of test machine crosshead displacement rate. Figure 8. Percent elongation in tension of the 63Sn-37Pb test material as a function of test machine crosshead displacement rate. Figure 9. Torque-twist plot of a torsion specimen from data acquired using the troptometer. The elastic and yield regions are shown. Figure 10. Method of calculating shear stress from a torque-twist curve. Figure 11. Shear modulus of the 63Sn-37Pb test material as a function of effective strain rate. Figure 12. Shear yield strength of the 63Sn-37Pb test material as a function of effective strain rate. Figure 13. Ultimate shear strength of the 63Sn-37Pb test material as a function of test machine twist rate. Figure 14. Comparison of Young's modulus data for 63Sn-37Pb and 60Sn‑40Pb solder as reported in the literature. Figure 15. Tensile and shear yield strength data as a function of effective strain rate with corresponding logarithmic fits of the data. Figure 16. Comparison of test data fit to two theoretical models of multiaxial yielding criteria.
|


|
|
|
Materials Science and Engineering Division | metallurgy@nist.gov Home | Personnel | Research Opportunities The National Institute of Standards and Technology (NIST) is an agency of the U.S. Commerce Department. Privacy policy / security notice / accessibility statement / Disclaimer / Freedom of Information Act (FOIA) / No Fear Act Policy / ExpectMore.gov (performance of federal programs) / NIST Information Quality Standards |